Vizualism verzorgt ook
trainingen en workshop
over information design.

Design Matters: Het Nieuwe Nieuws
Talk at Amsterdam
Pakhuis de Zwijger/

With the release of Google Earth Studio, generating virtual flyby’s over any part of the world, load 3D camera tracking points into AfterEffects becomes really easy.
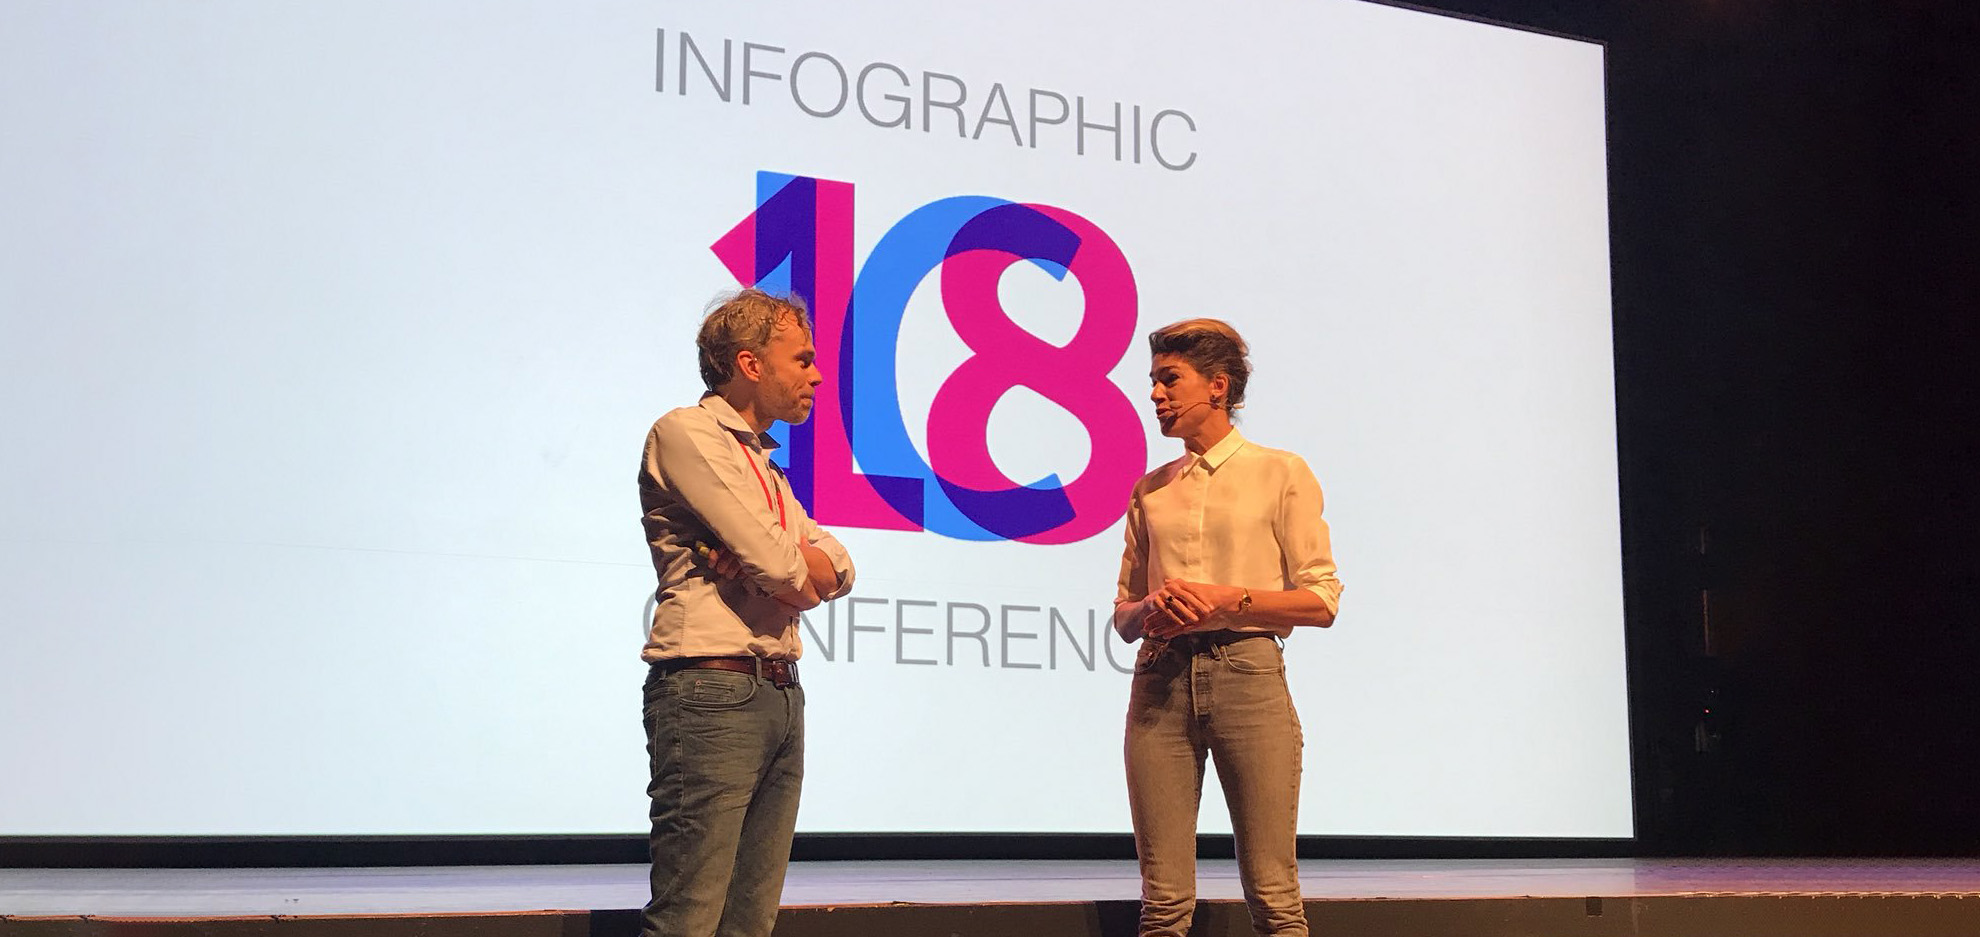
 The Society of News Design is proud to announce their next SND conference on November 7th, 8th, 9th in Amsterdam. The ‘City of Freedom’ will play host to a three-day event will be filled with learning, networking and talks evolving around the general theme of SND: Smart News Design.
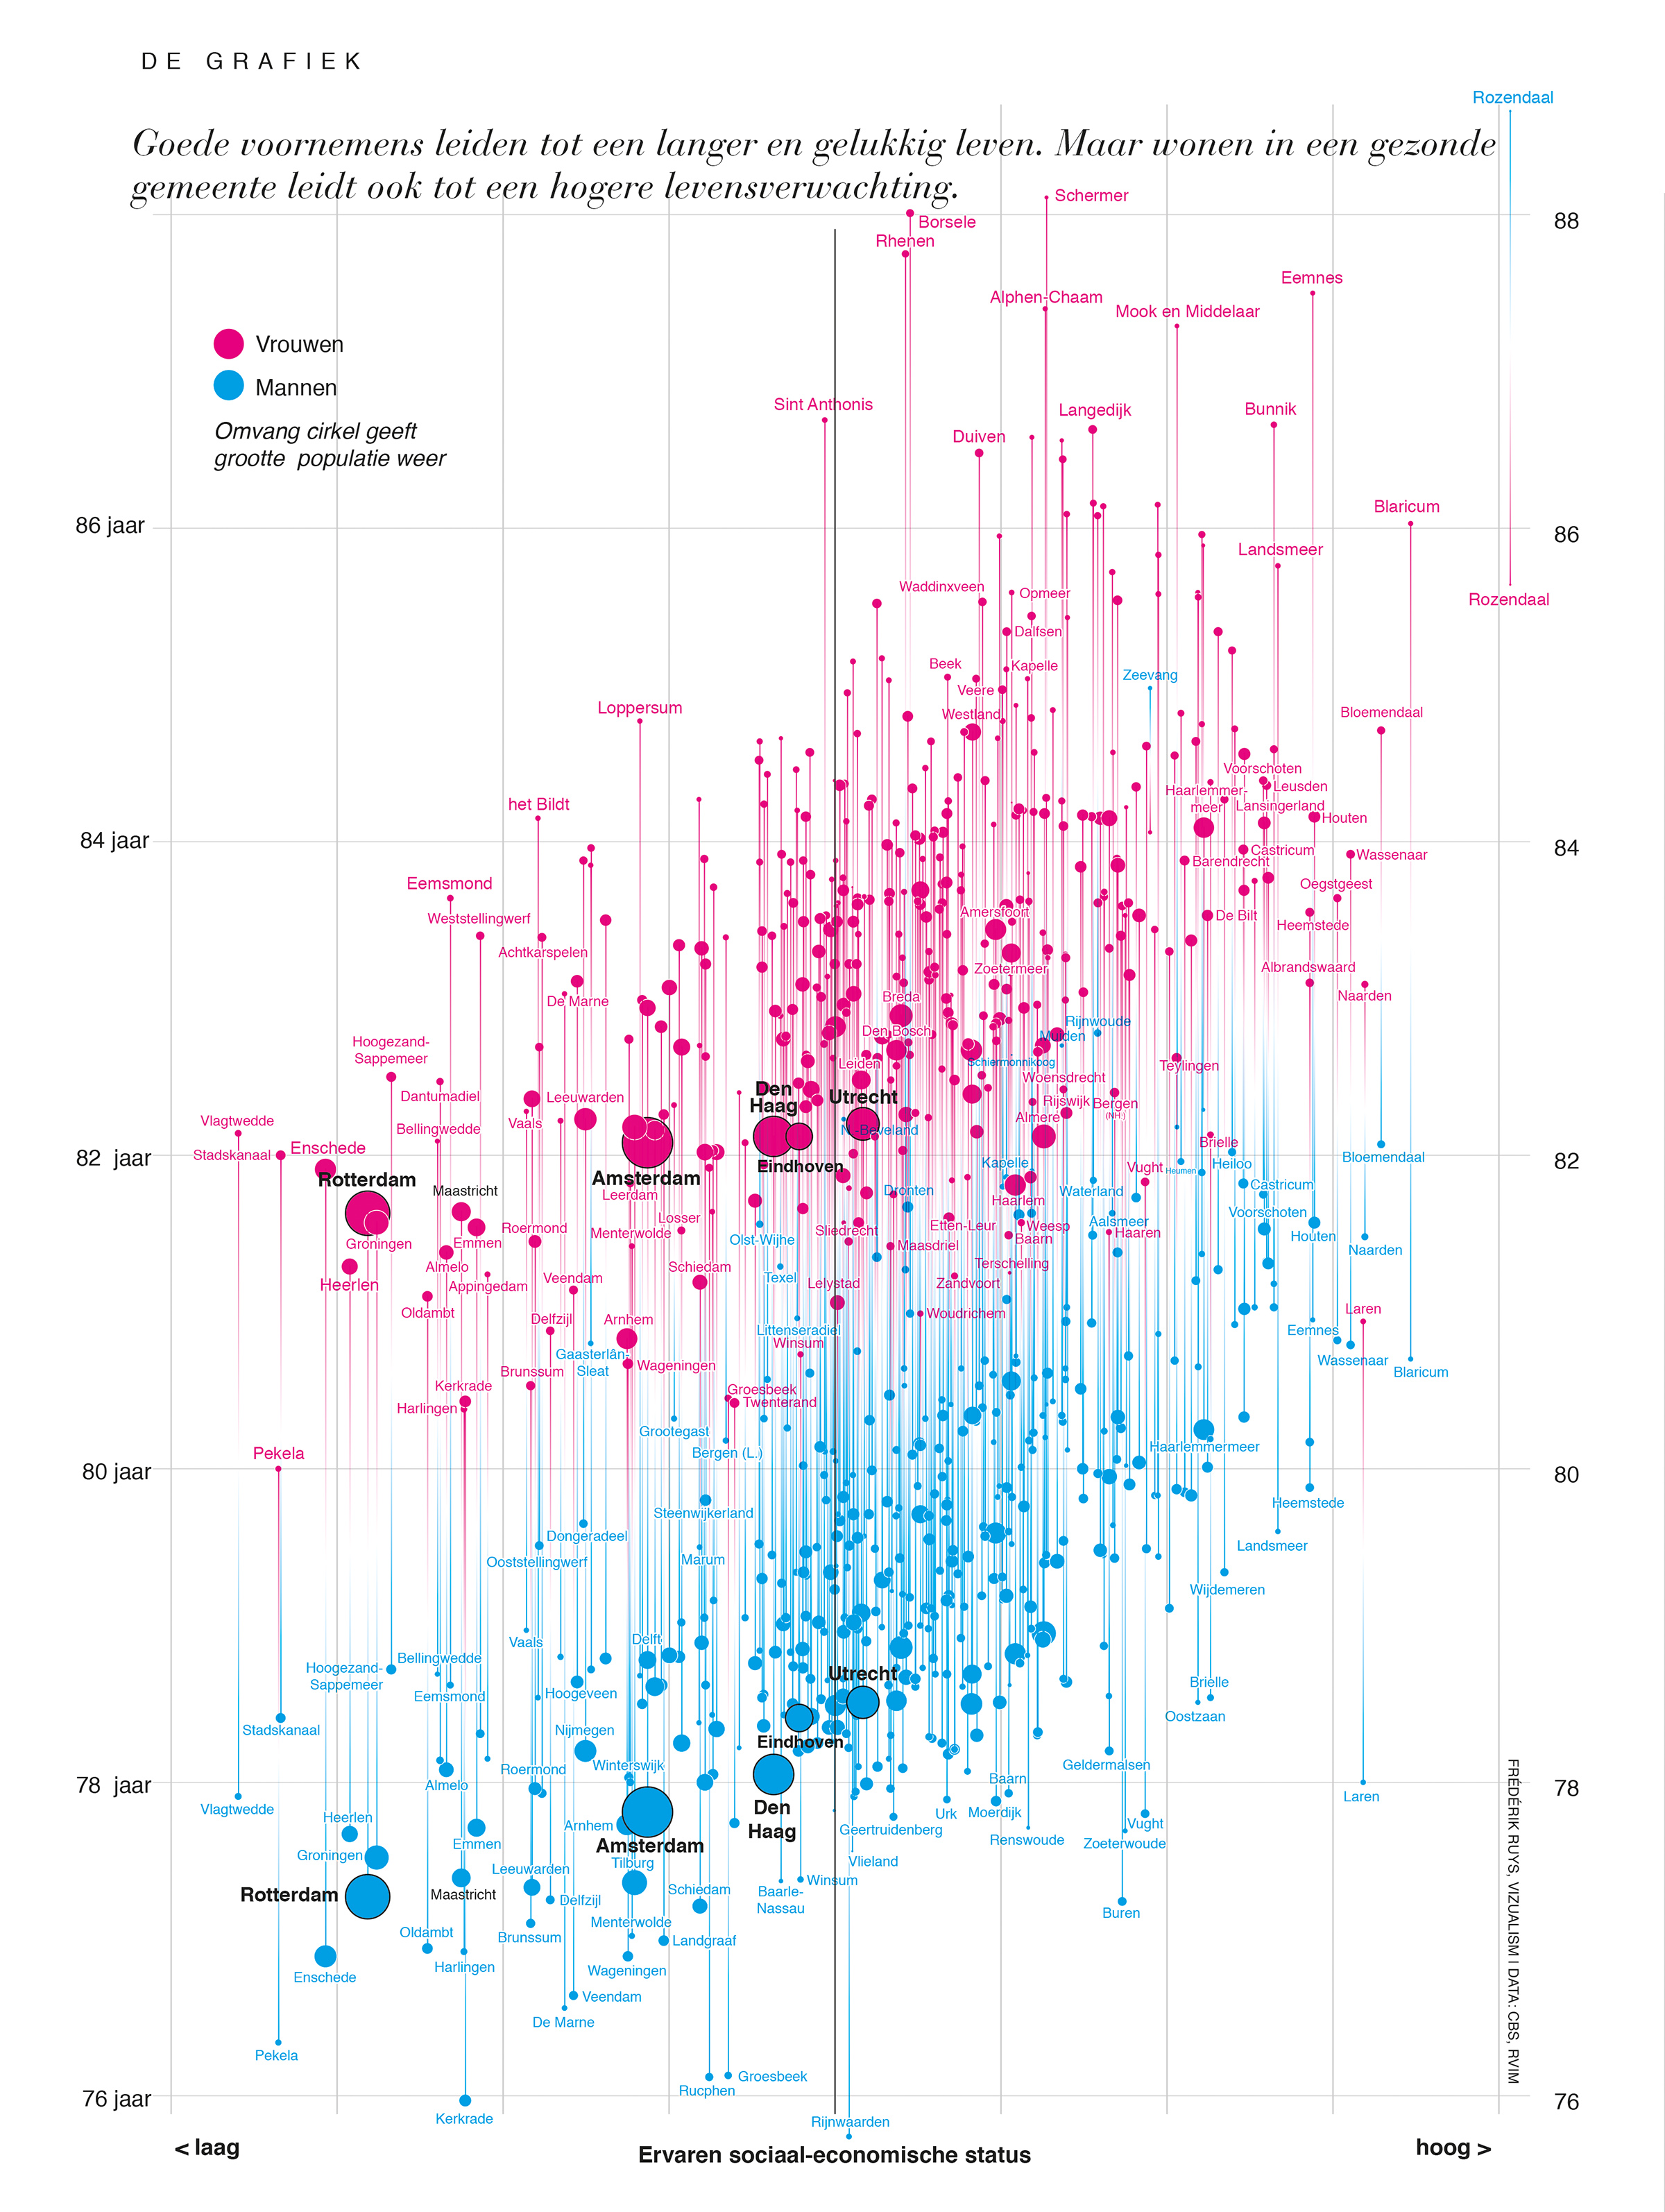
 Reconstructing an infographic on life expectancy in Dutch cities (previously published in Vrij Nederland) using this awesome tool: Data Illustrator, a great research collaboration between Adobe Systems Inc. and Georgia Institute of Technology.
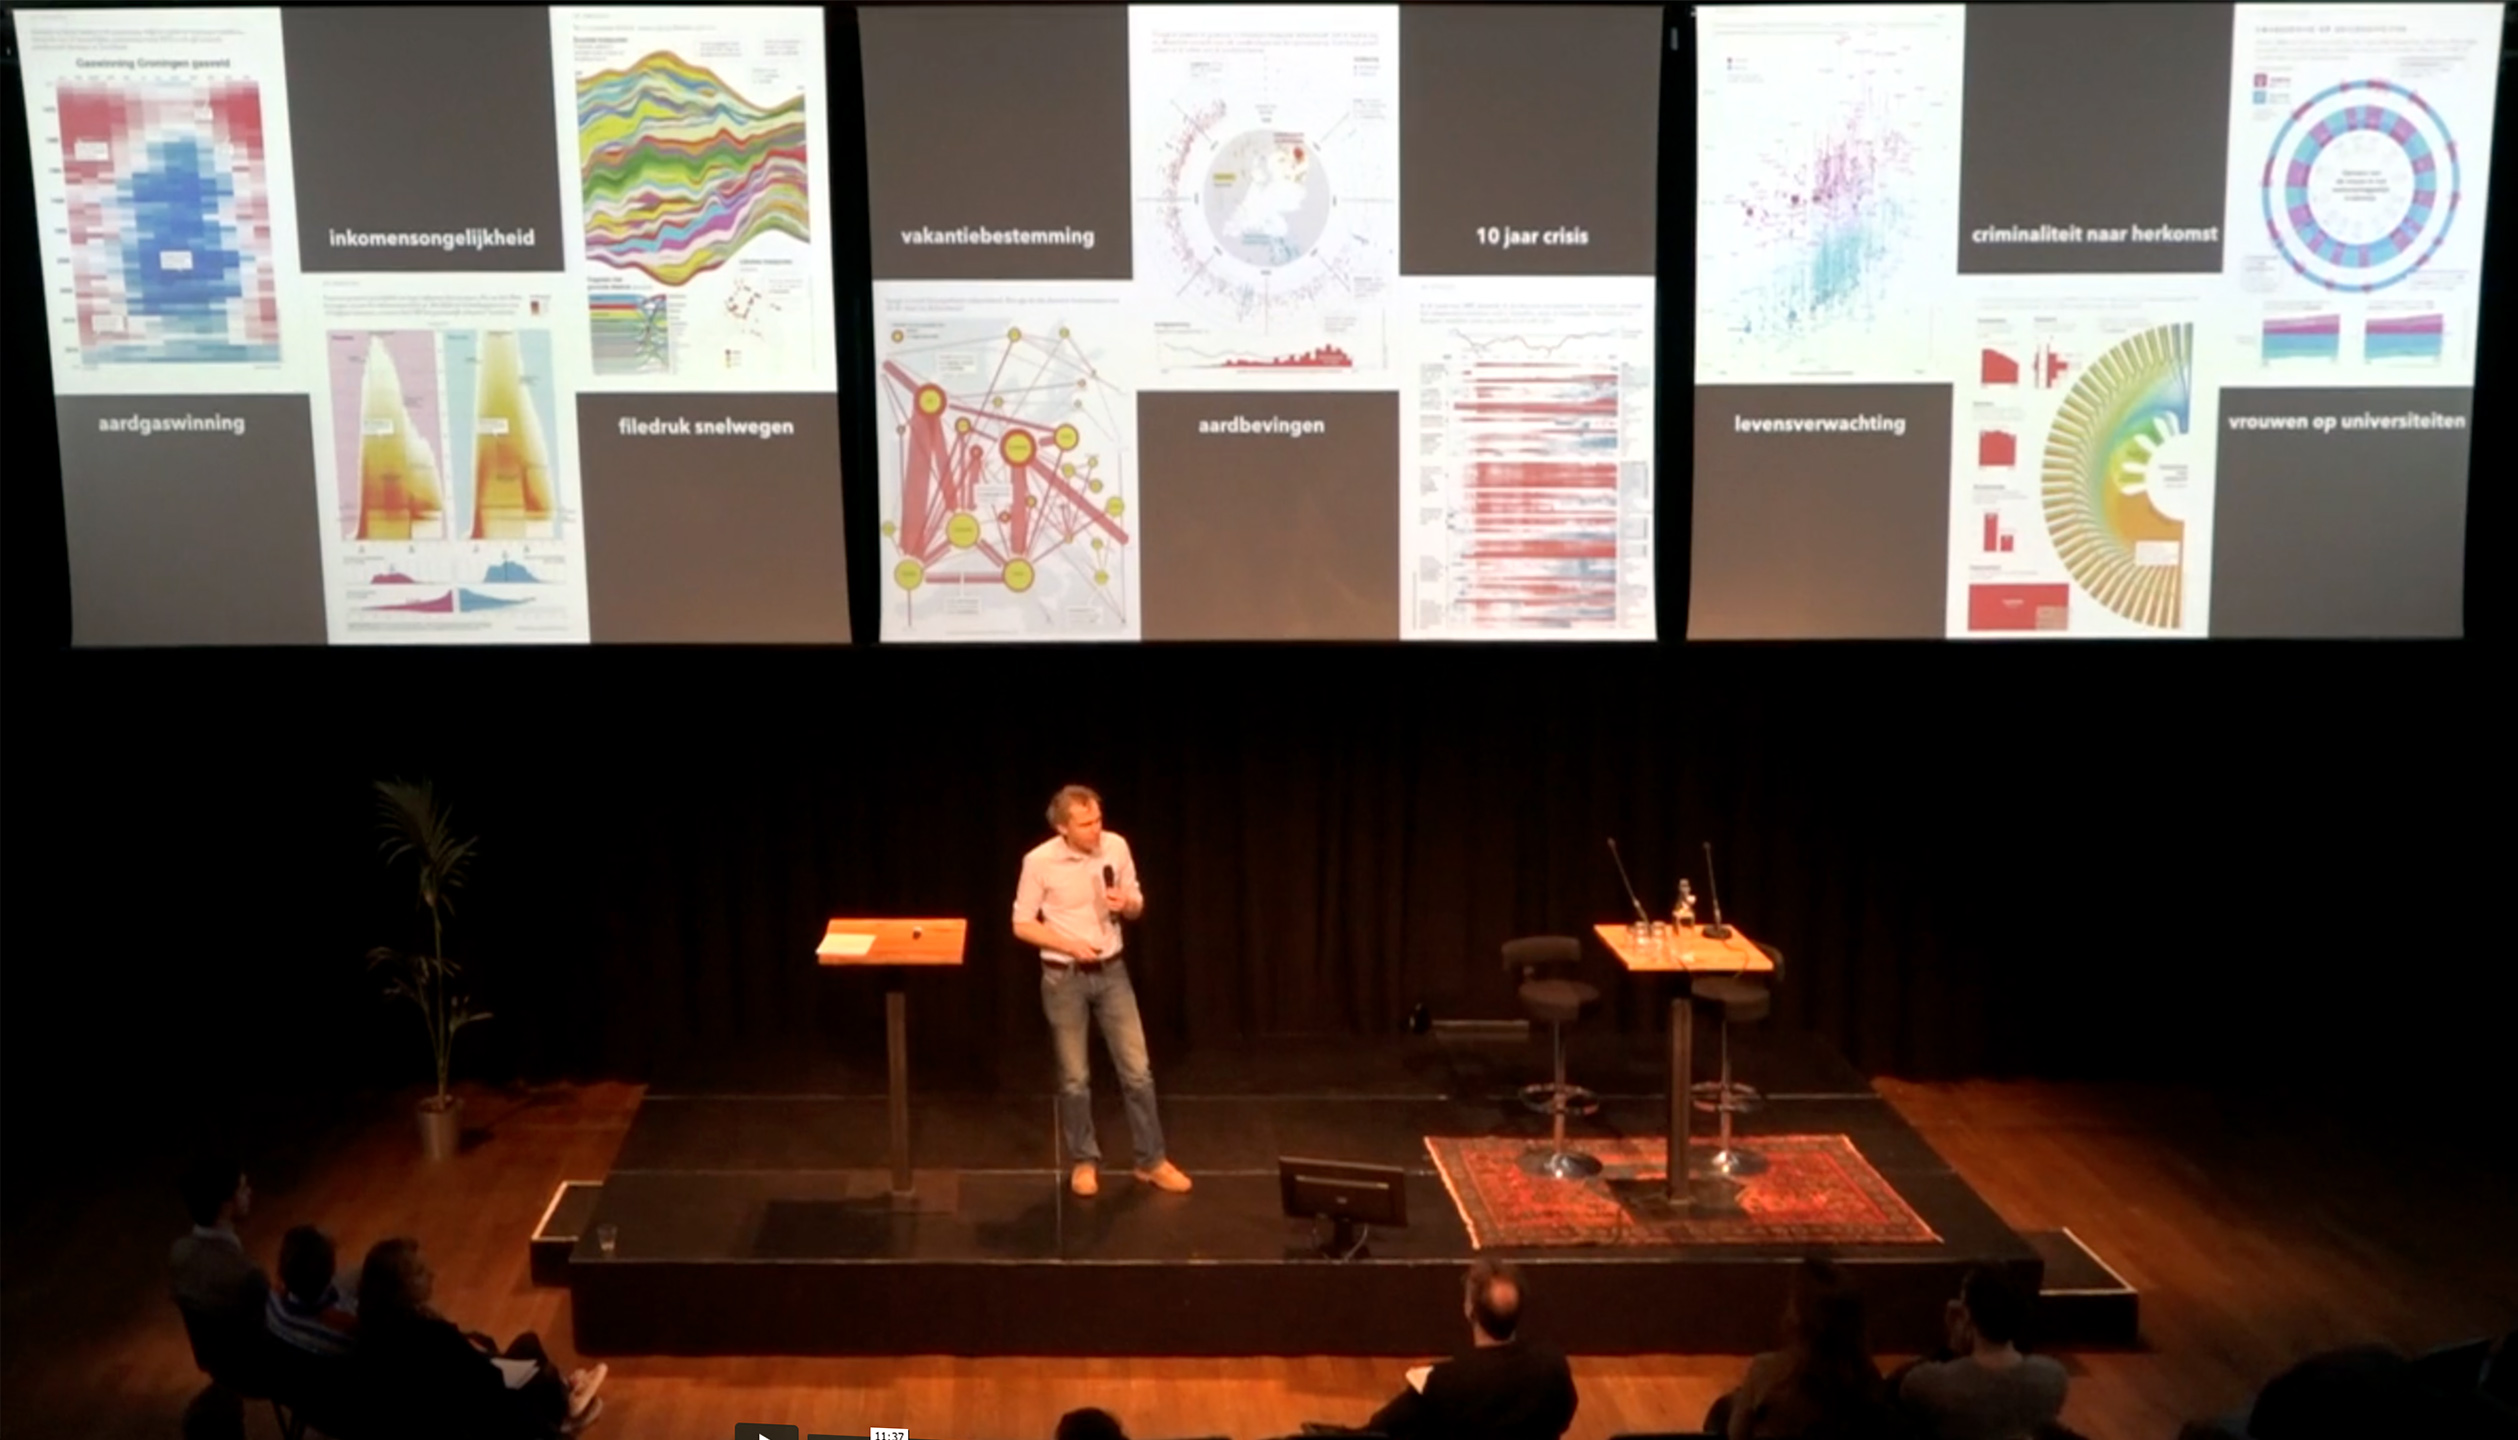 De journalistiek staat voor grote veranderingen – en uitdagingen. Er wordt druk geëxperimenteerd met virtual reality en visuele presentatievormen als infographics en data-visualisaties. Tegelijkertijd staat de betrouwbaarheid van nieuws onder druk. Welke rol spelen ontwerpers in dit veranderende medialandschap? Het Nieuwe Nieuws in Pakhuis de Zwijger.
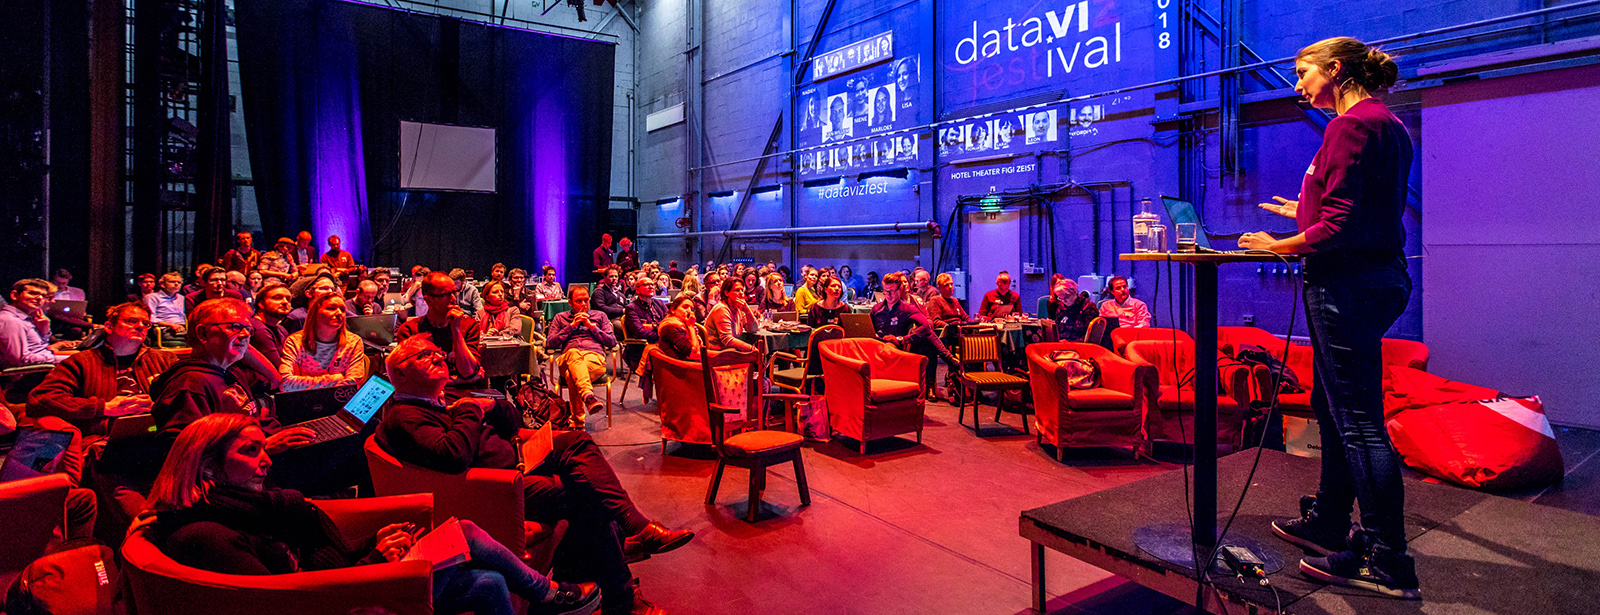
In navolging van de populaire databorrels, vieren we 8 februari het DataViz Festival. Ga ’s middags zelf aan de slag onder leiding van de beste in het vak en laat je ’s avonds inspireren door flitsende lightning talks. Ontvangst vanaf 13 uur.
Dit najaar doen Ramses Reijerman en Frédérik Ruys een infographic crash course. Een praktijkgerichte stoomcursus bestemd voor iedereen die complexe informatie inzichtelijk wil maken. Meer informatie hier.

Eindhoven is woensdag 23 augustus het decor voor onze jaarlijks terugkerende #databorrel. We zijn er te gast bij de collega’s van Mapcreator, op steenworpafstand van het station. Houd deze pagina in de gaten voor informatie.
Tot dan!


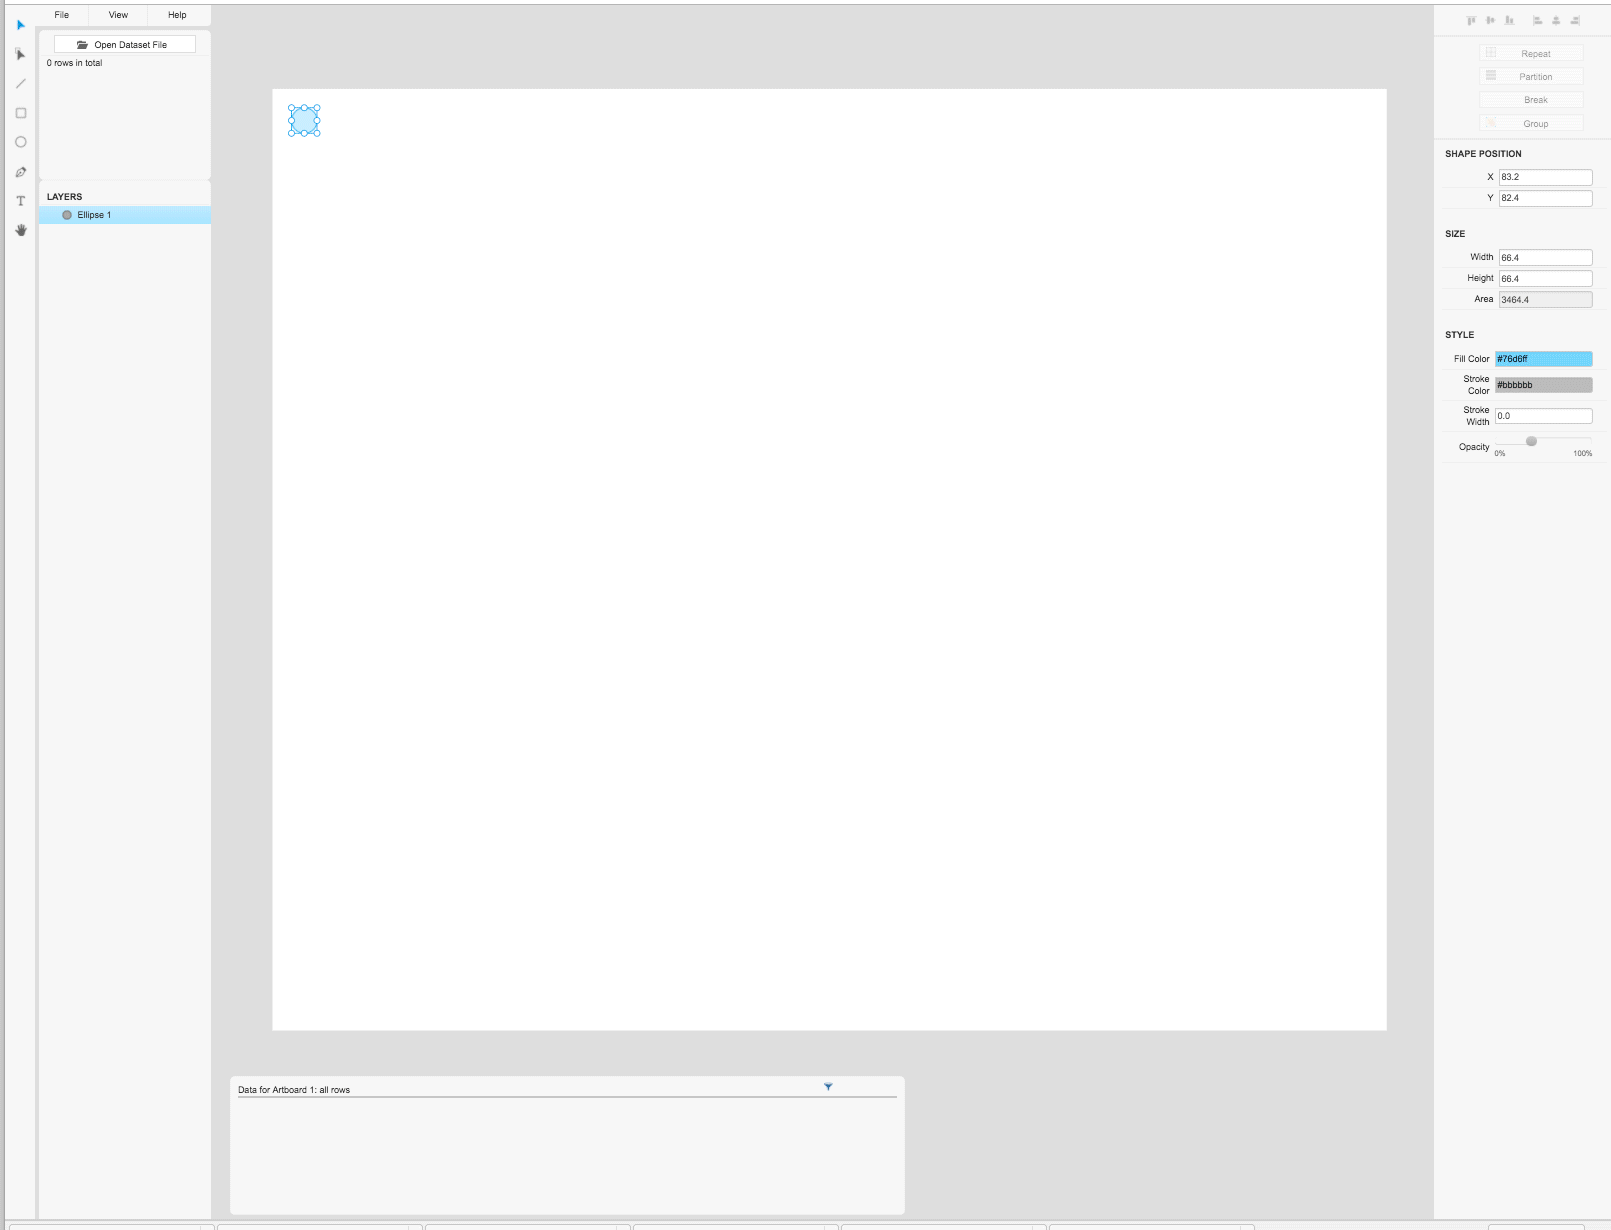
 Step by step tutorial
 Step by step tutorial

