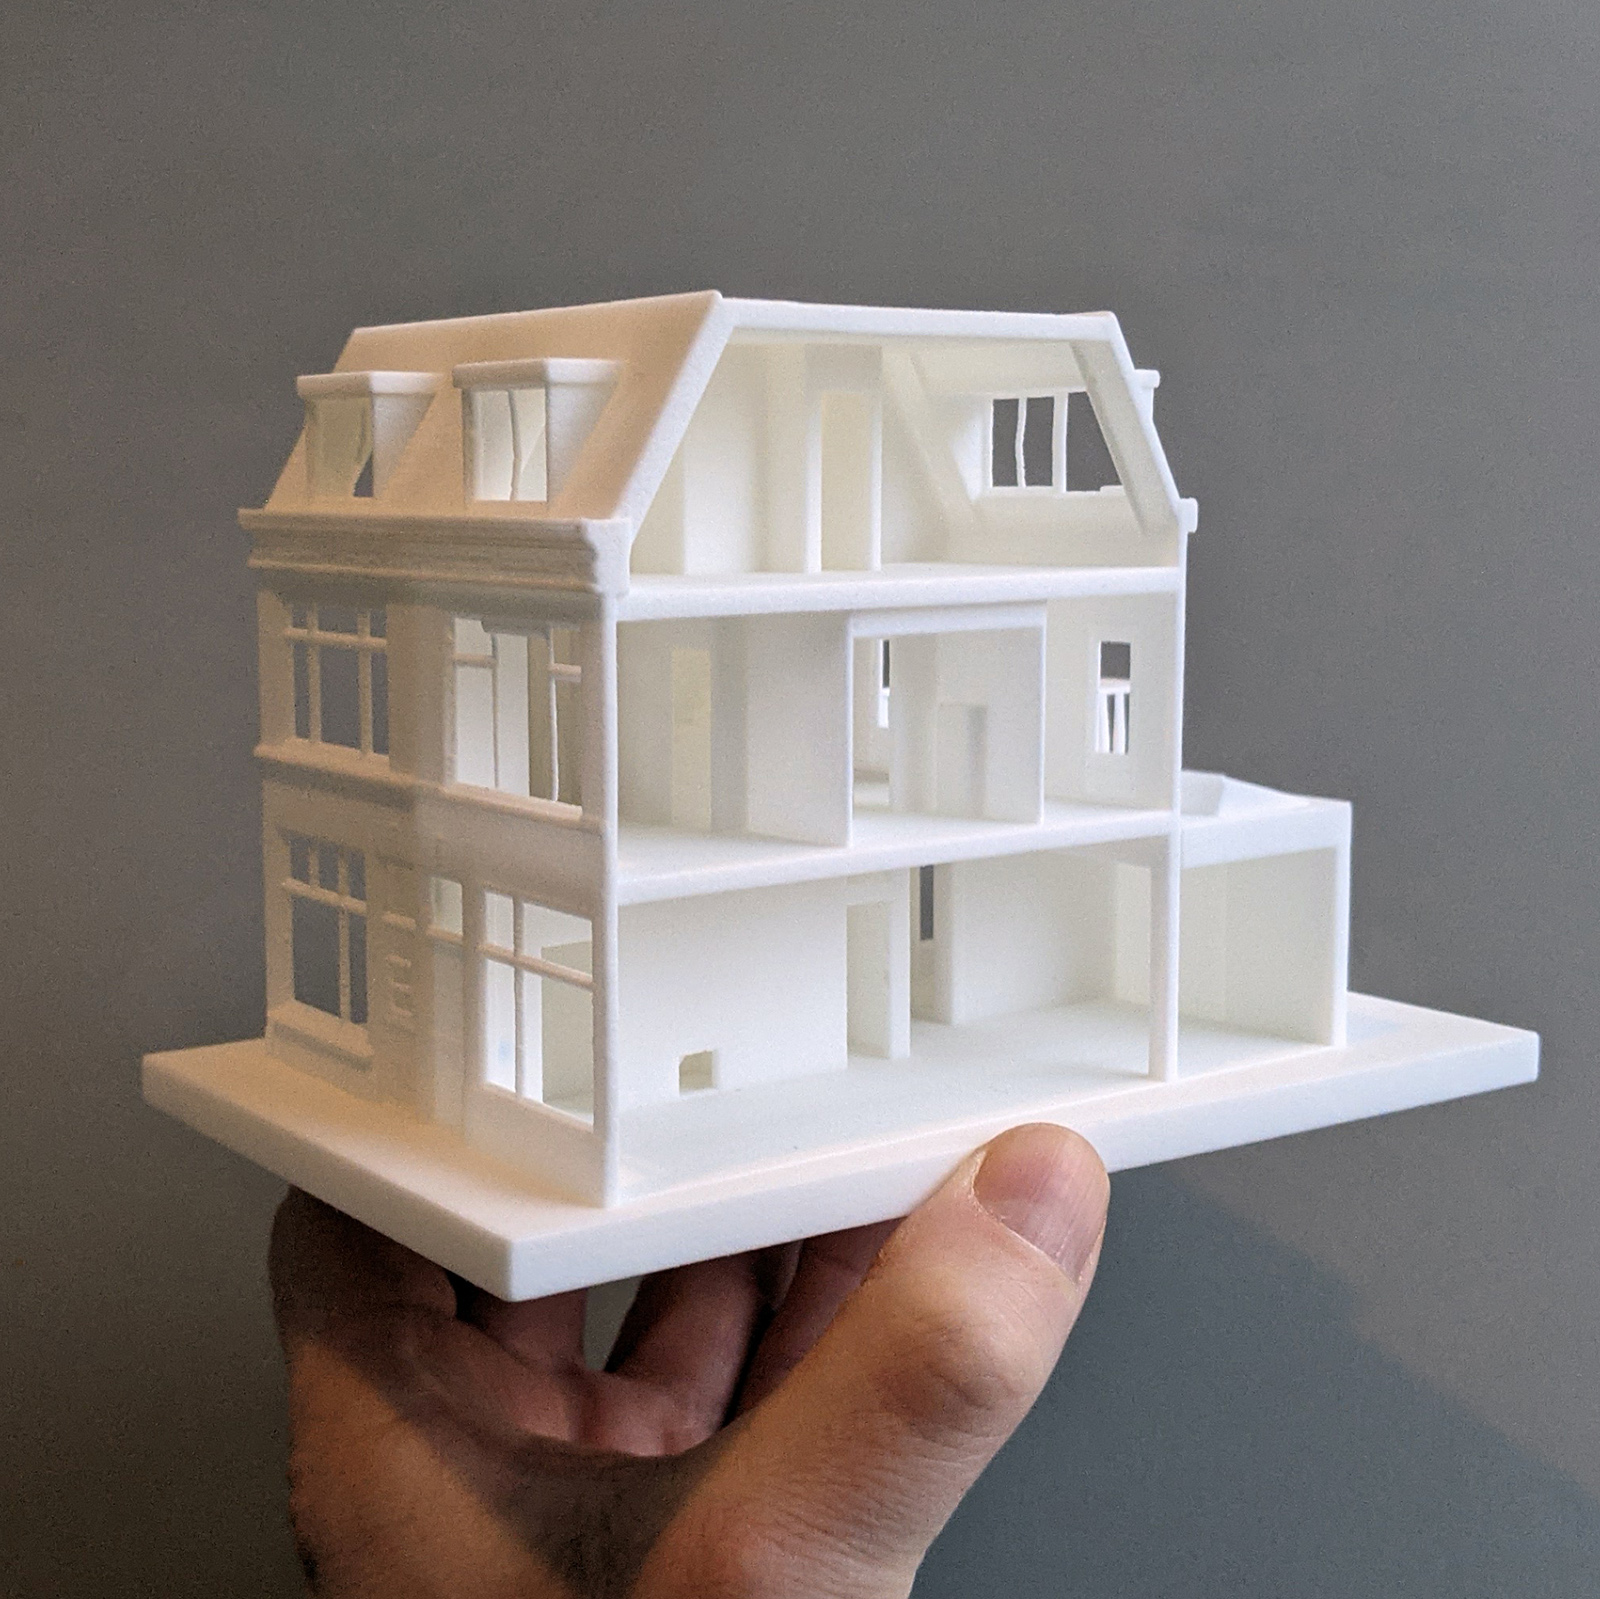
3D print of home / office
Experimenting with the new STL-export in SketchupPro 2021.

.embed-container { position: relative; padding-bottom: 56.25%; height: 0; overflow: hidden; max-width: 100%; } .embed-container iframe, .embed-container object, .embed-container embed { position: absolute; top: 0; left: 0; width: 100%; height: 100%; }
Hilda Pruijs (54) woont al negenentwintig jaar in ‘haar’ straatje in de Utrechtse wijk Wittevrouwen. Toch ontdekte Pruijs laatst pas dat er een bakkerszaak bij haar om de hoek zit. Hoe dat kan? De Utrechtse lijdt aan het syndroom van Usher en is daardoor doofblind. Reden genoeg voor buurman Frederik om een 3D-kaart te ontwerpen, zodat Hilda kan voelen hoe haar wijk er nu eigenlijk bij staat.
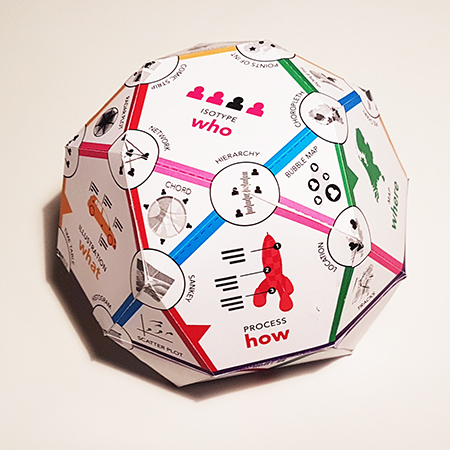
 It can be hard to find the most appropriate visualization method. But the basic journalistic questions and the structure of your data-set already define your visualization. To help you find it, I build this taxonomy.
 By using Sketchup Pro’s improved intersect tool on extruded letters, I was able to merge both names of Noah and Finn into one model.
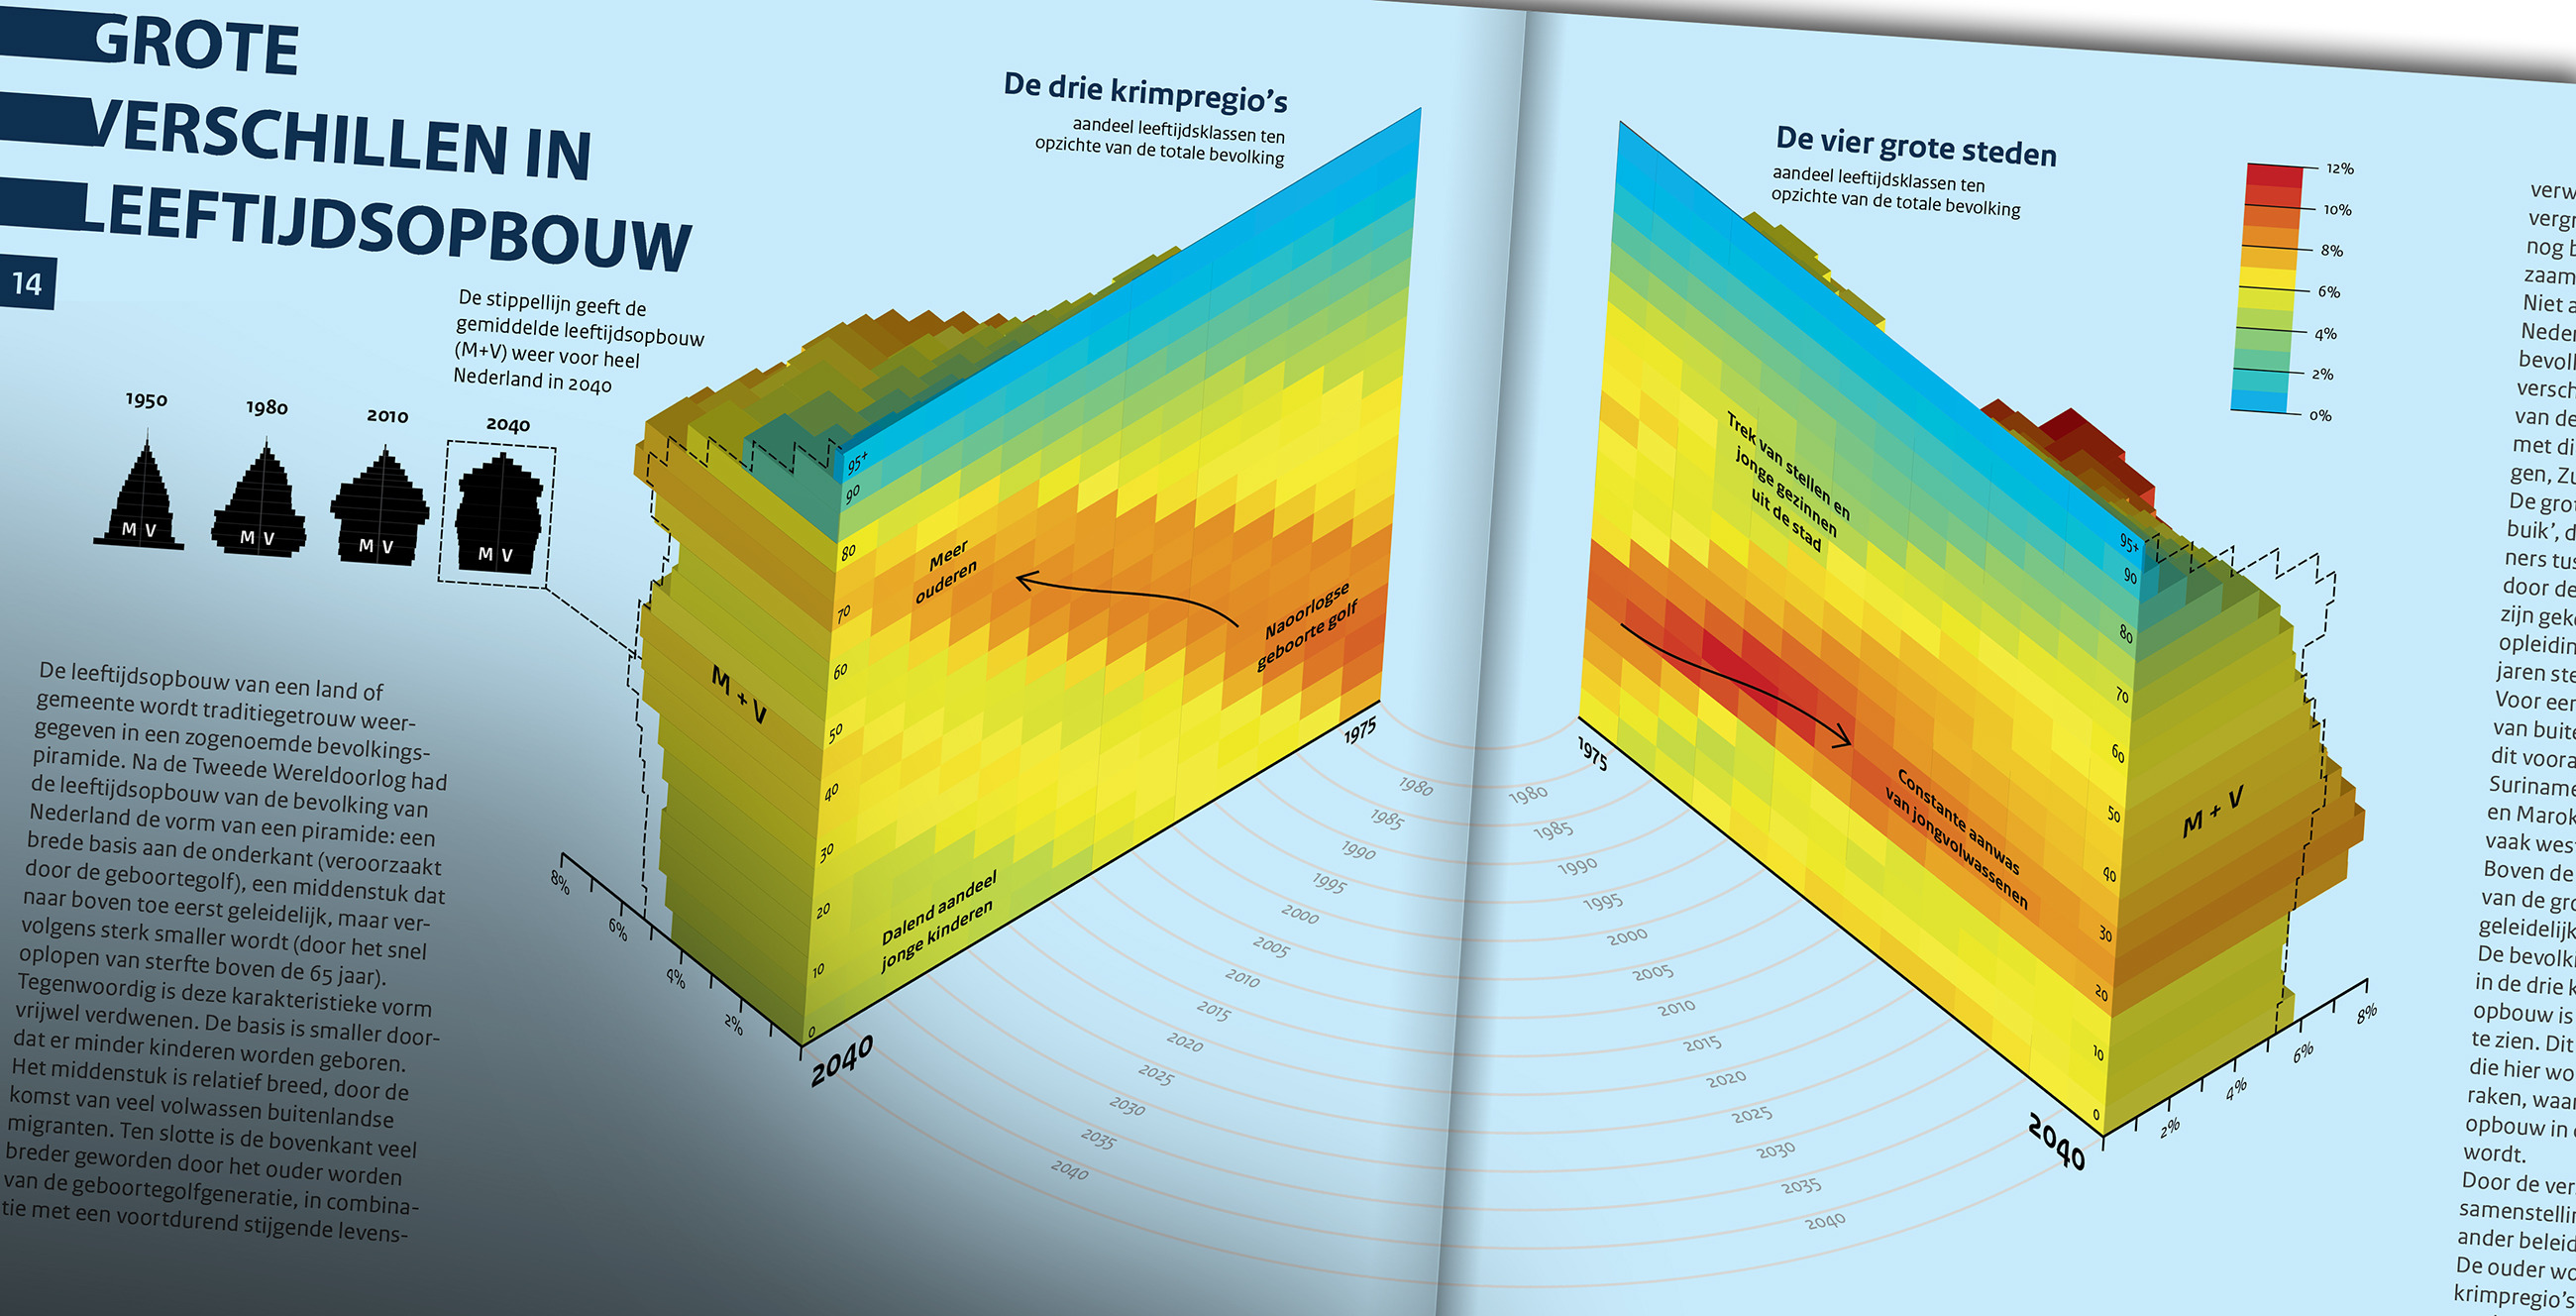
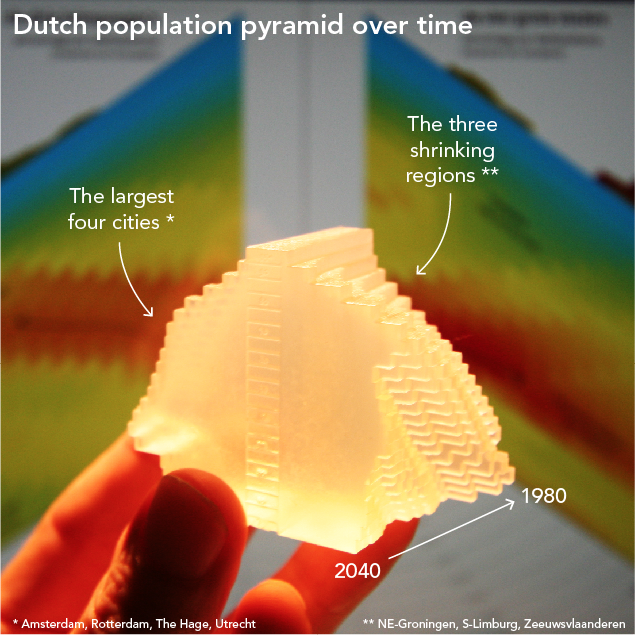 Demographic transition of the forth largest cities of the Netherlands vs the three shrinking regions from 1980 to 2040. This data sculpture is based on Dutch census data from CBS and prognosis of the Environmental Assesment Agency PBL. Original infographic published in ‘De Nederlandse bevolking in beeld’ (2014)
View in shapeways -store.

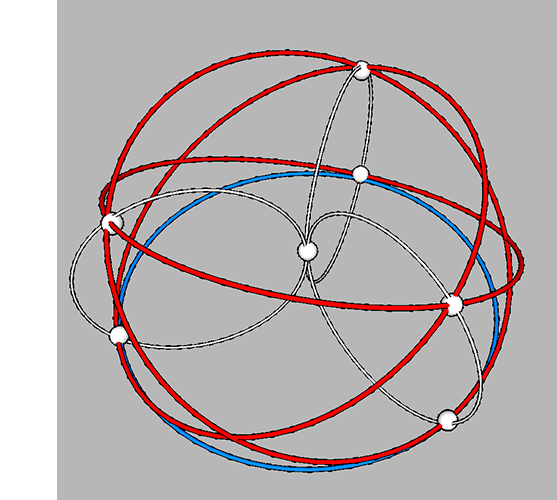 Prof. dr. Pieter H.M. Ruys from the Tilburg School of Economics and Management wrote several papers on Theories of Representation and used the fano Matroid to visualize tripolar role patterns and their force fields.
A force field describes the interaction between several forces that act upon each other. The actors may be participants in a discussion, players and spectators in a stadium, or an artist handling his material. Force fields are evidently also experienced and identified in nature.
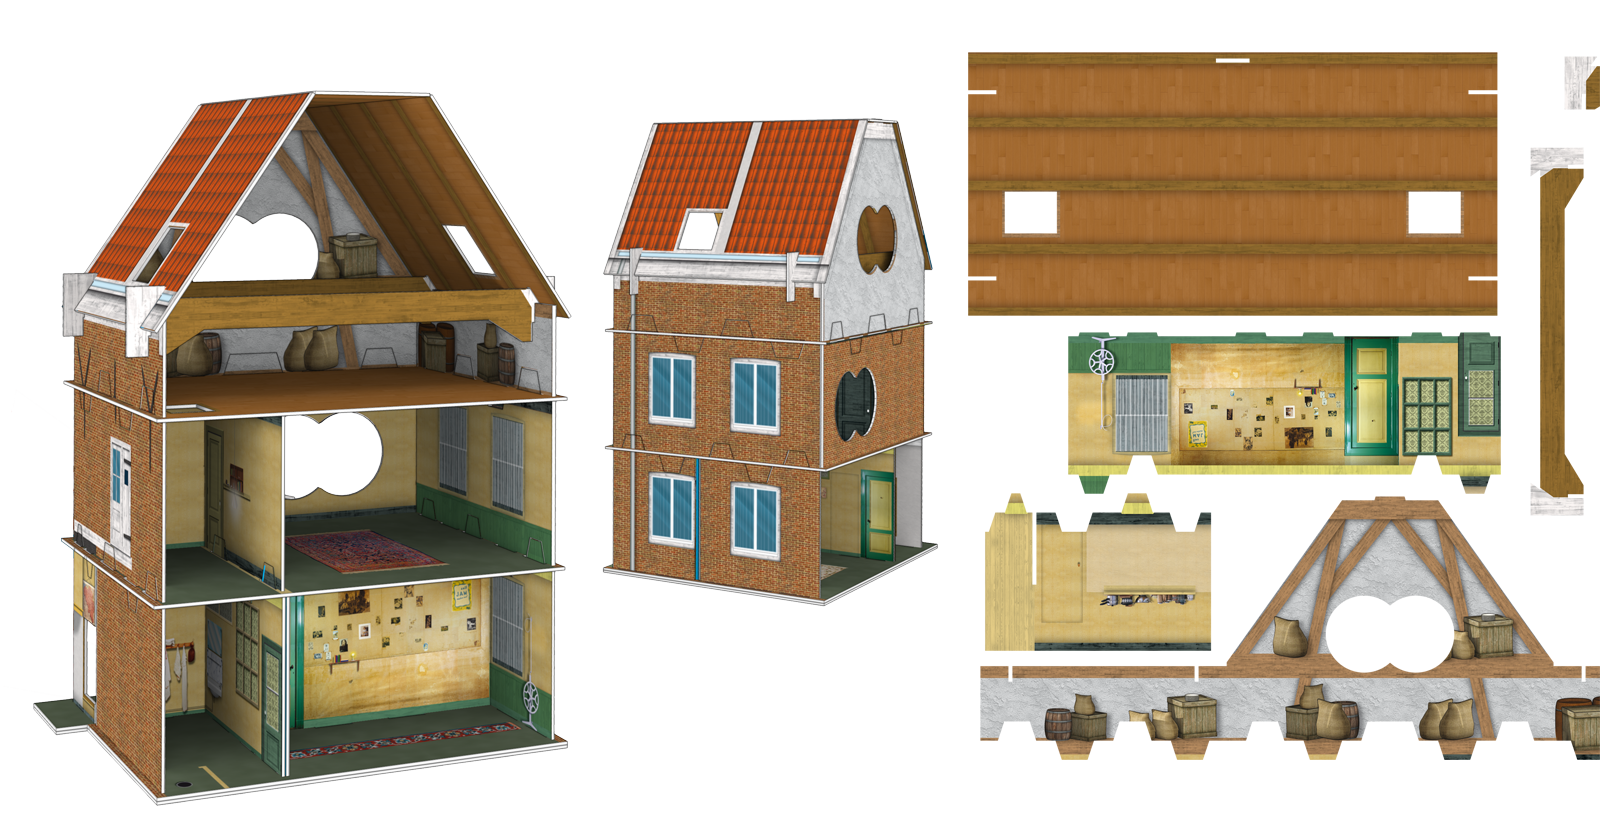
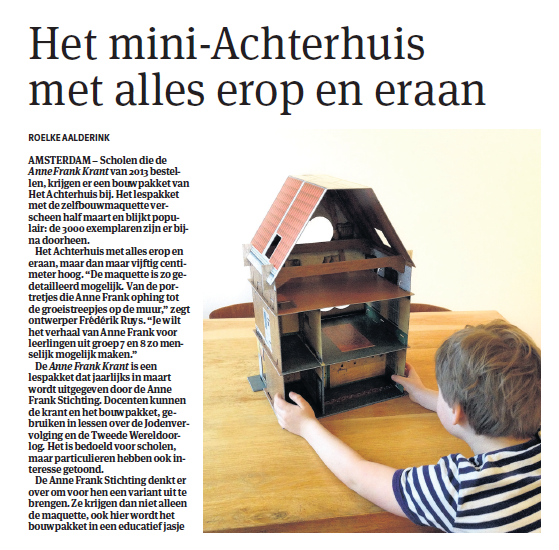 After working many years on a accurate reconstruction of Anne Frank’s hiding place in Amsterdam (which has been nominated for a Dutch Infographic Award), Chantal van Wessel and Frederik Ruys illustrated the construction kit of the secret annex, commissioned by the Anne Frank Foundation and Dutch agency Young Crowds. The kit is specially developed for pupils at primary schools.