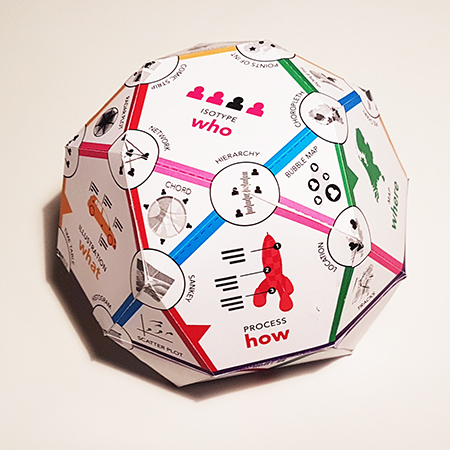
3D print of home / office
Experimenting with the new STL-export in SketchupPro 2021.

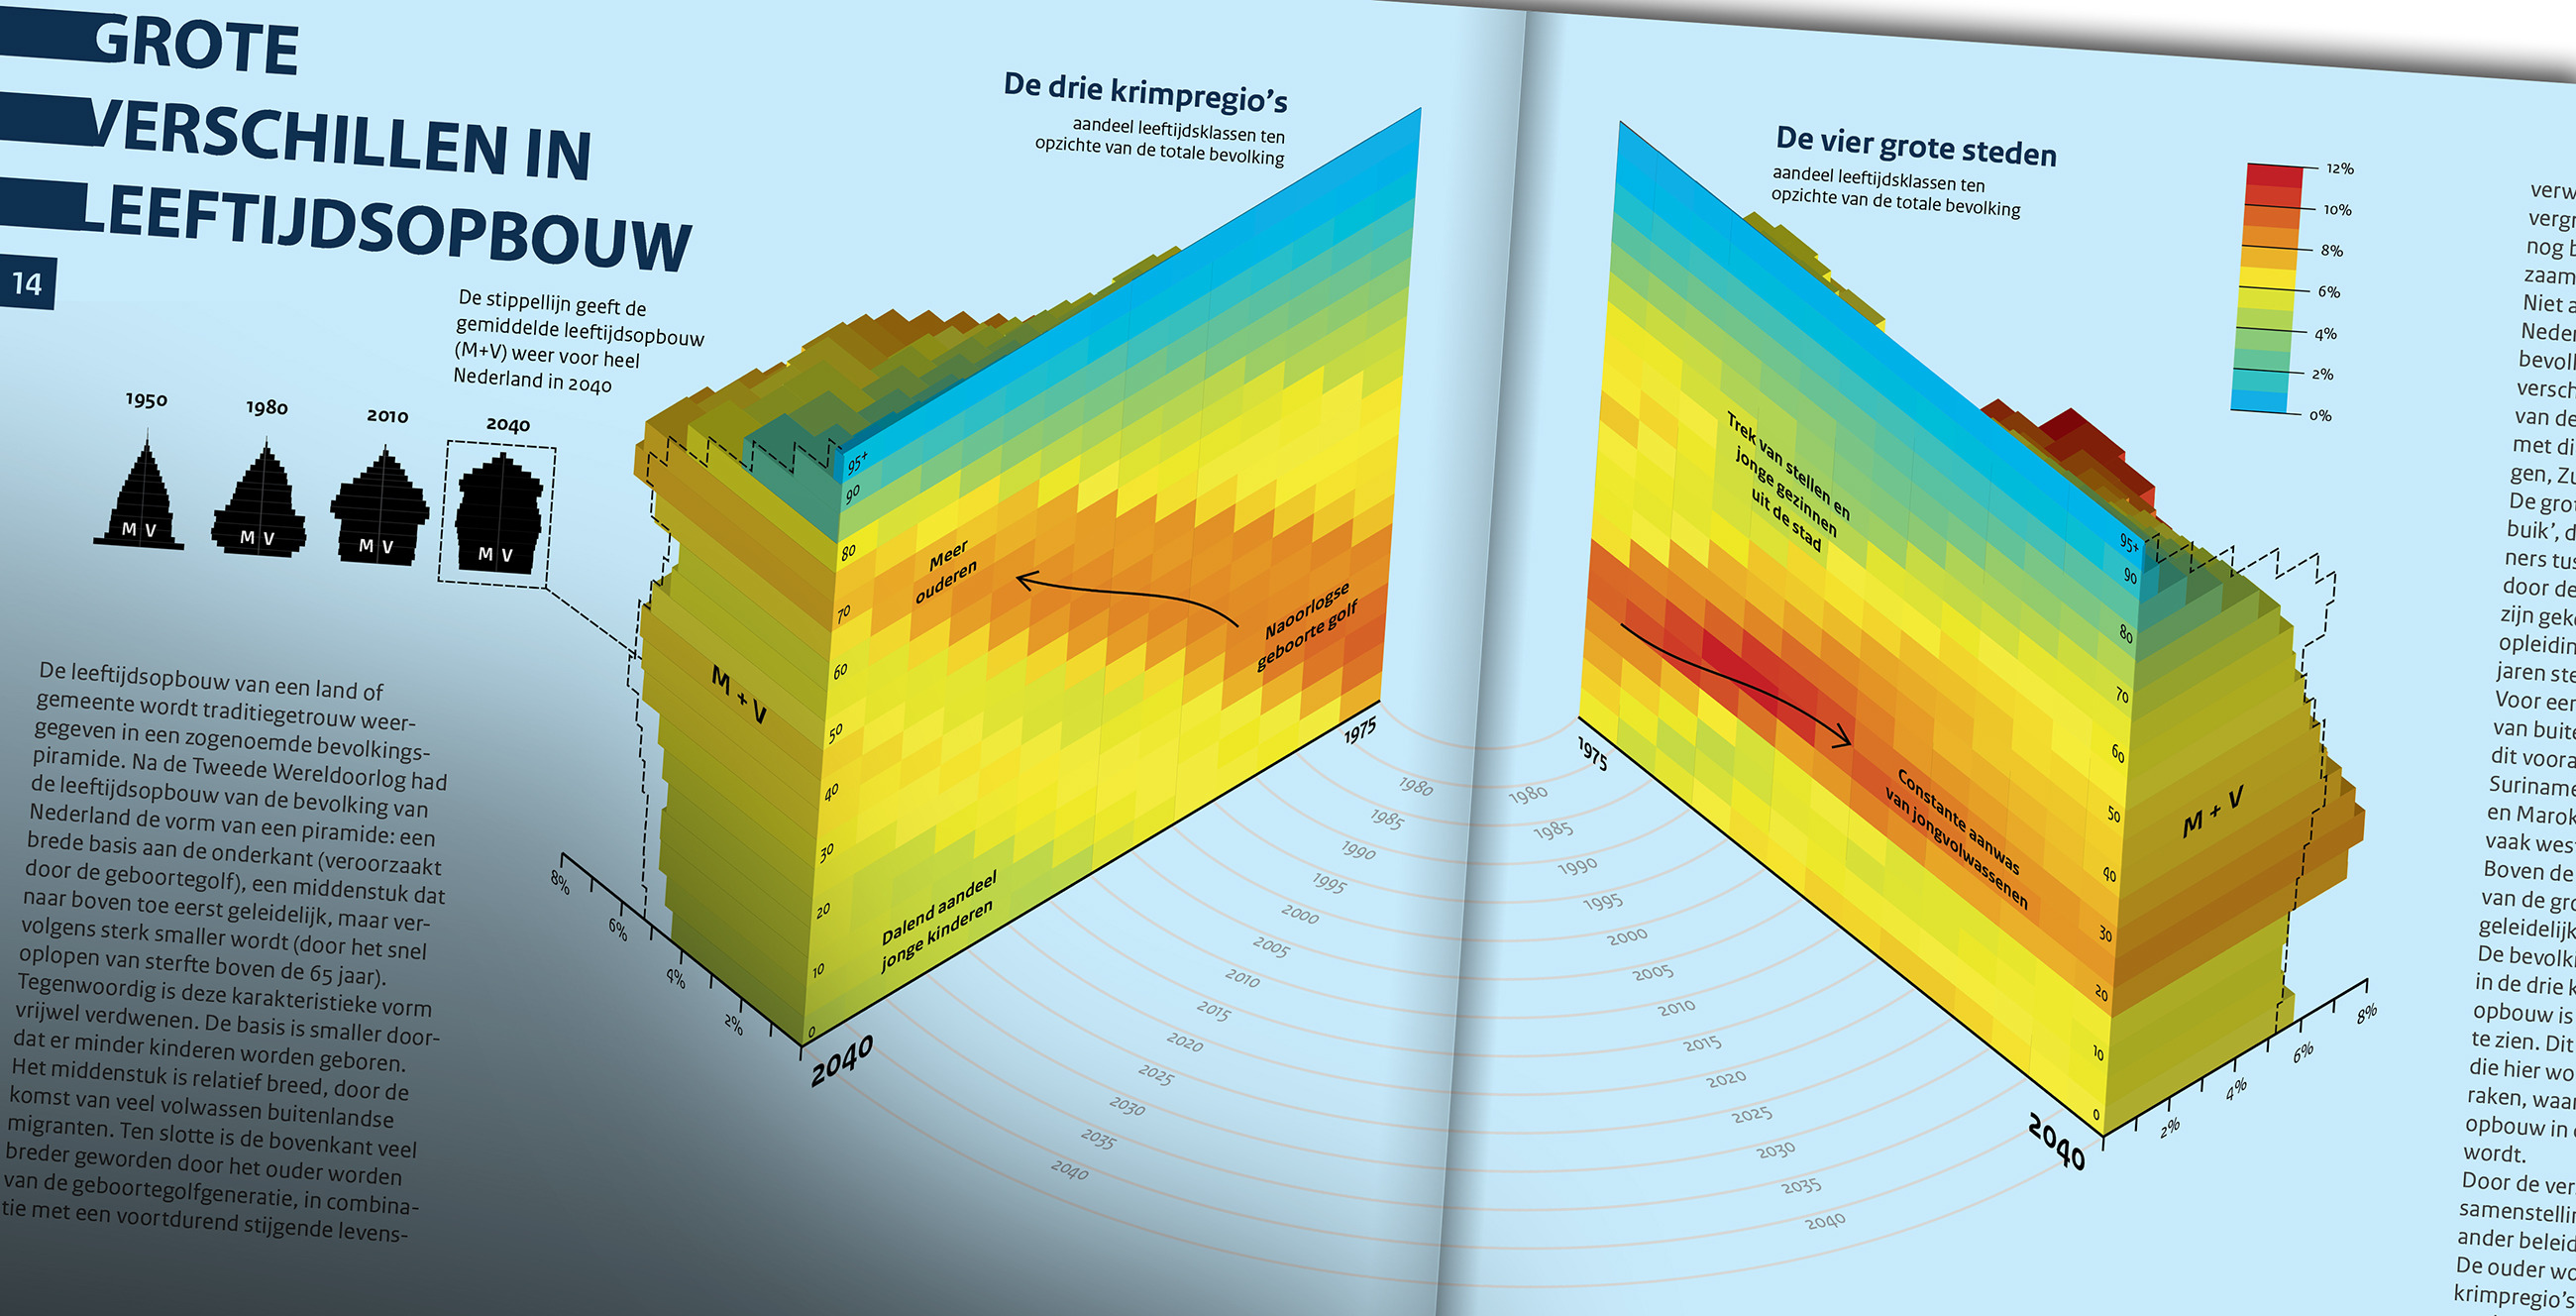
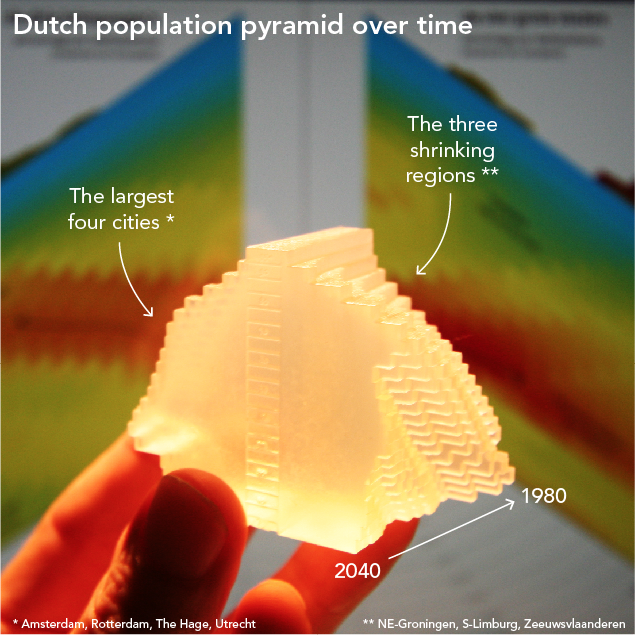
Demographic transition of the forth largest cities of the Netherlands vs the three shrinking regions from 1980 to 2040. This data sculpture is based on Dutch census data from CBS and prognosis of the Environmental Assesment Agency PBL. Original infographic published in ‘De Nederlandse bevolking in beeld’ (2014)
View in shapeways -store.