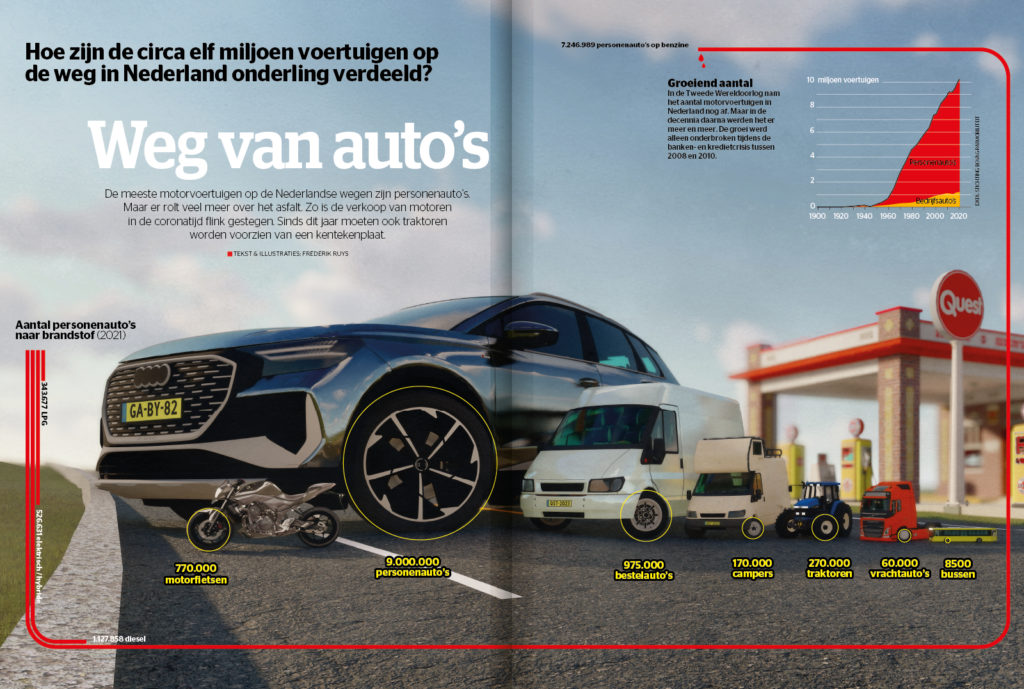
Aantal auto’s in Nederland
Maart 2023
Infographic Quest
Meer info

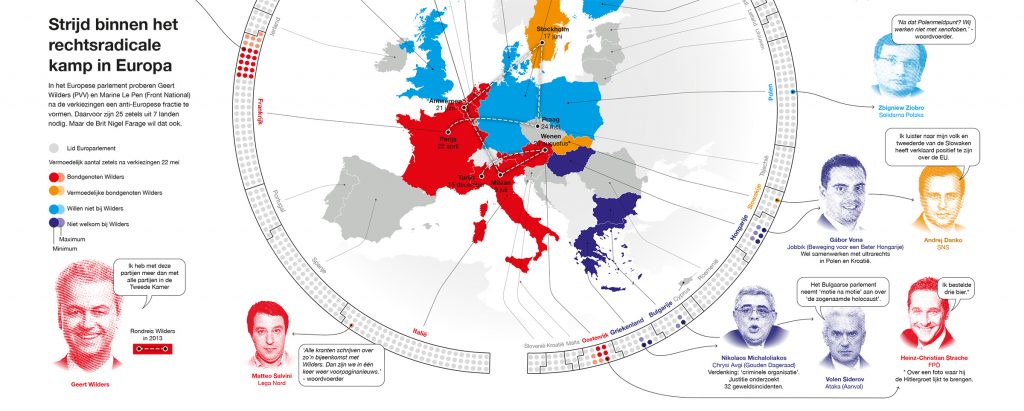 In het Europese Parlement proberen Geert Wilders (PVV) en Marine Le Pen (Front National) na de verkiezingen van 2014 een anti-Europese fractie te vormen. Maar de Brit Nigel Farage wil dat ook. Visualisatie van het rechts-radicale kamp voor Vrij Nederland.
.embed-container { position: relative; padding-bottom: 56.25%; height: 0; overflow: hidden; max-width: 100%; } .embed-container iframe, .embed-container object, .embed-container embed { position: absolute; top: 0; left: 0; width: 100%; height: 100%; }
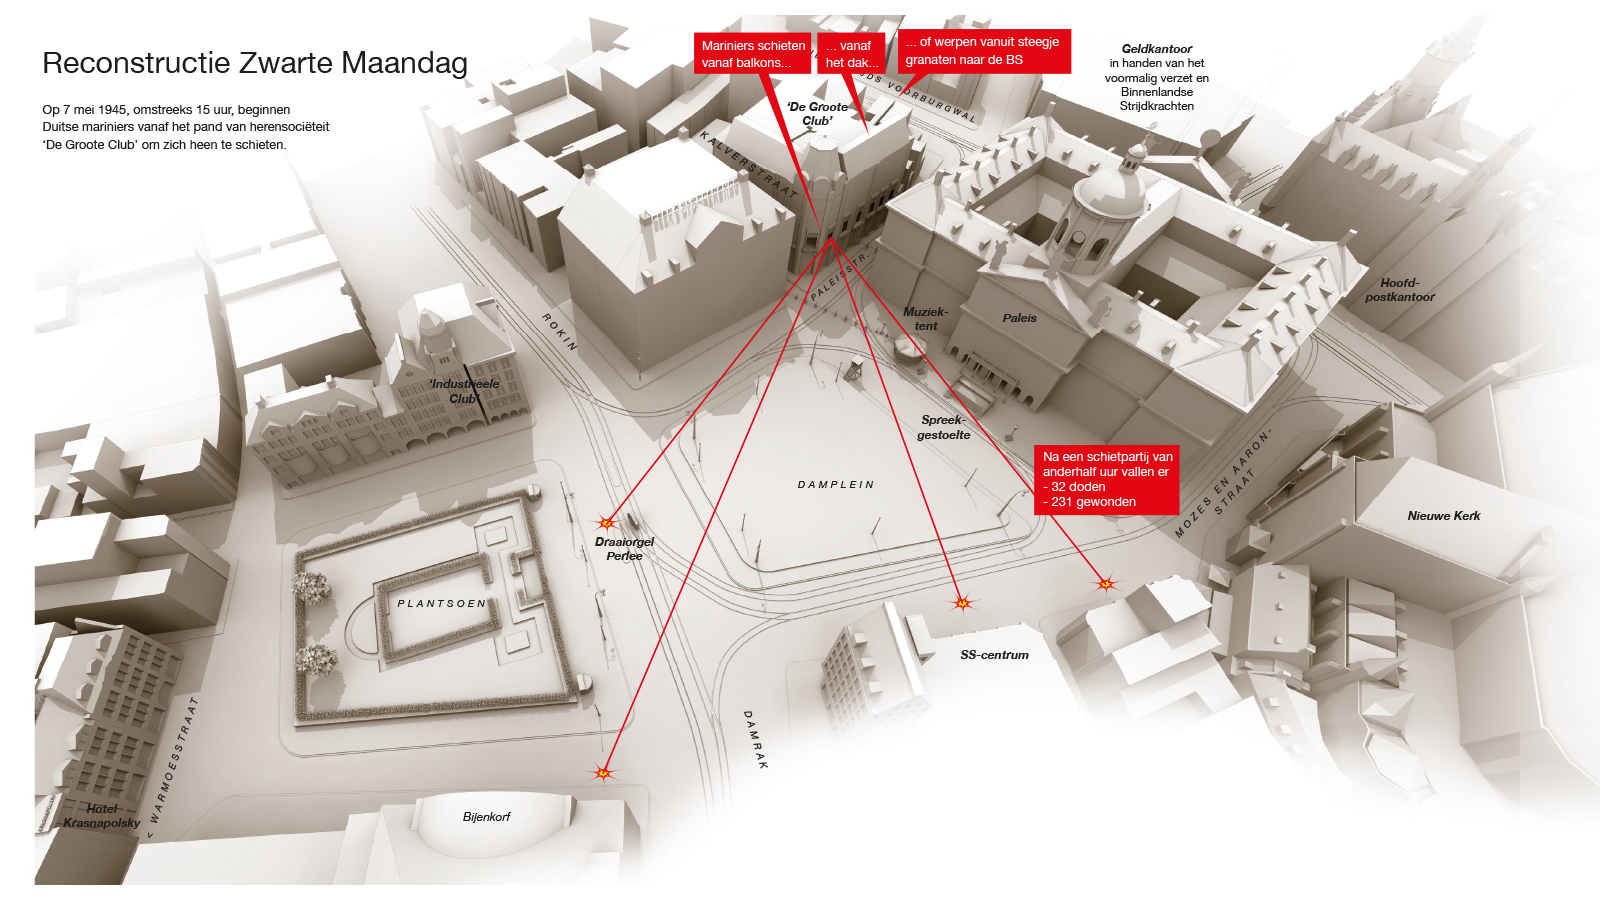
Volgens de mythe begonnen Duitse mariniers op 7 mei 1945 vanuit hun hoofdkwartier aan de Paleisstraat zomaar te schieten op de feestvierende menigte op de Dam. Maar was dat wel zo? Was het Dam-incident wel een incident?
Feitelijke reconstructie ter ondersteuning van het historische onderzoek van Auke Kok gepubliceerd in Vrij Nederland en bij Uitgeverij Fosfor als ‘long read’, april 2014.
.
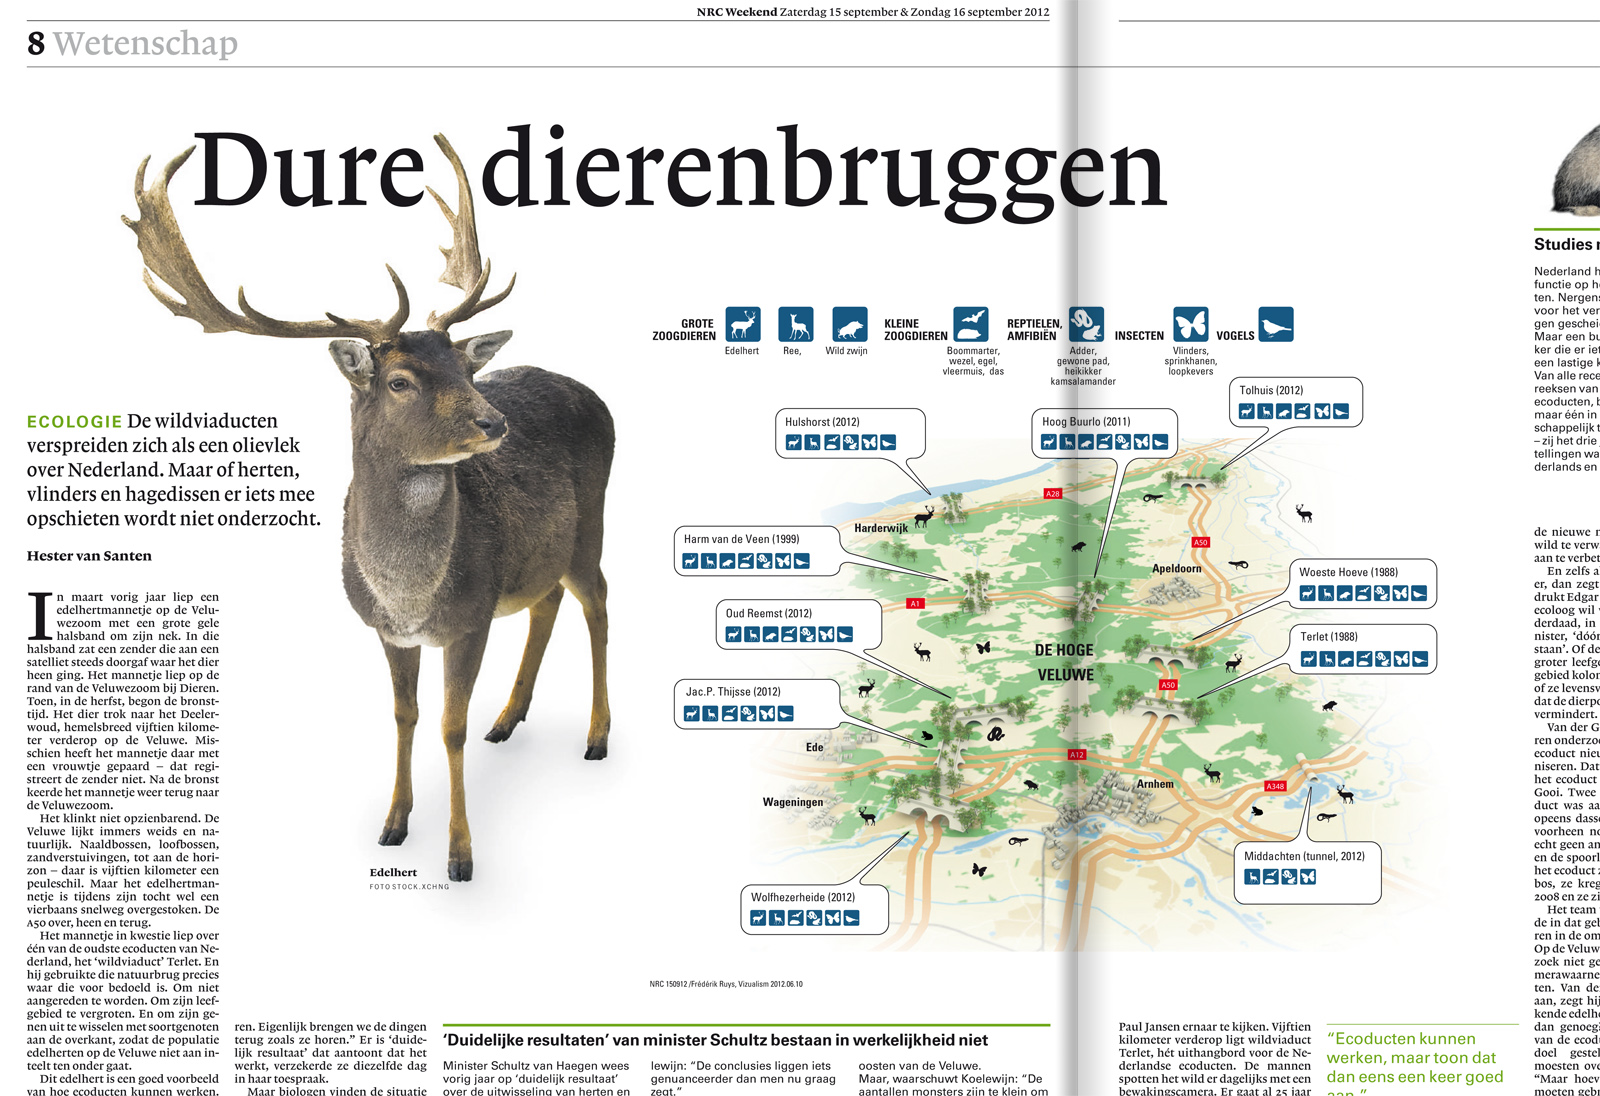
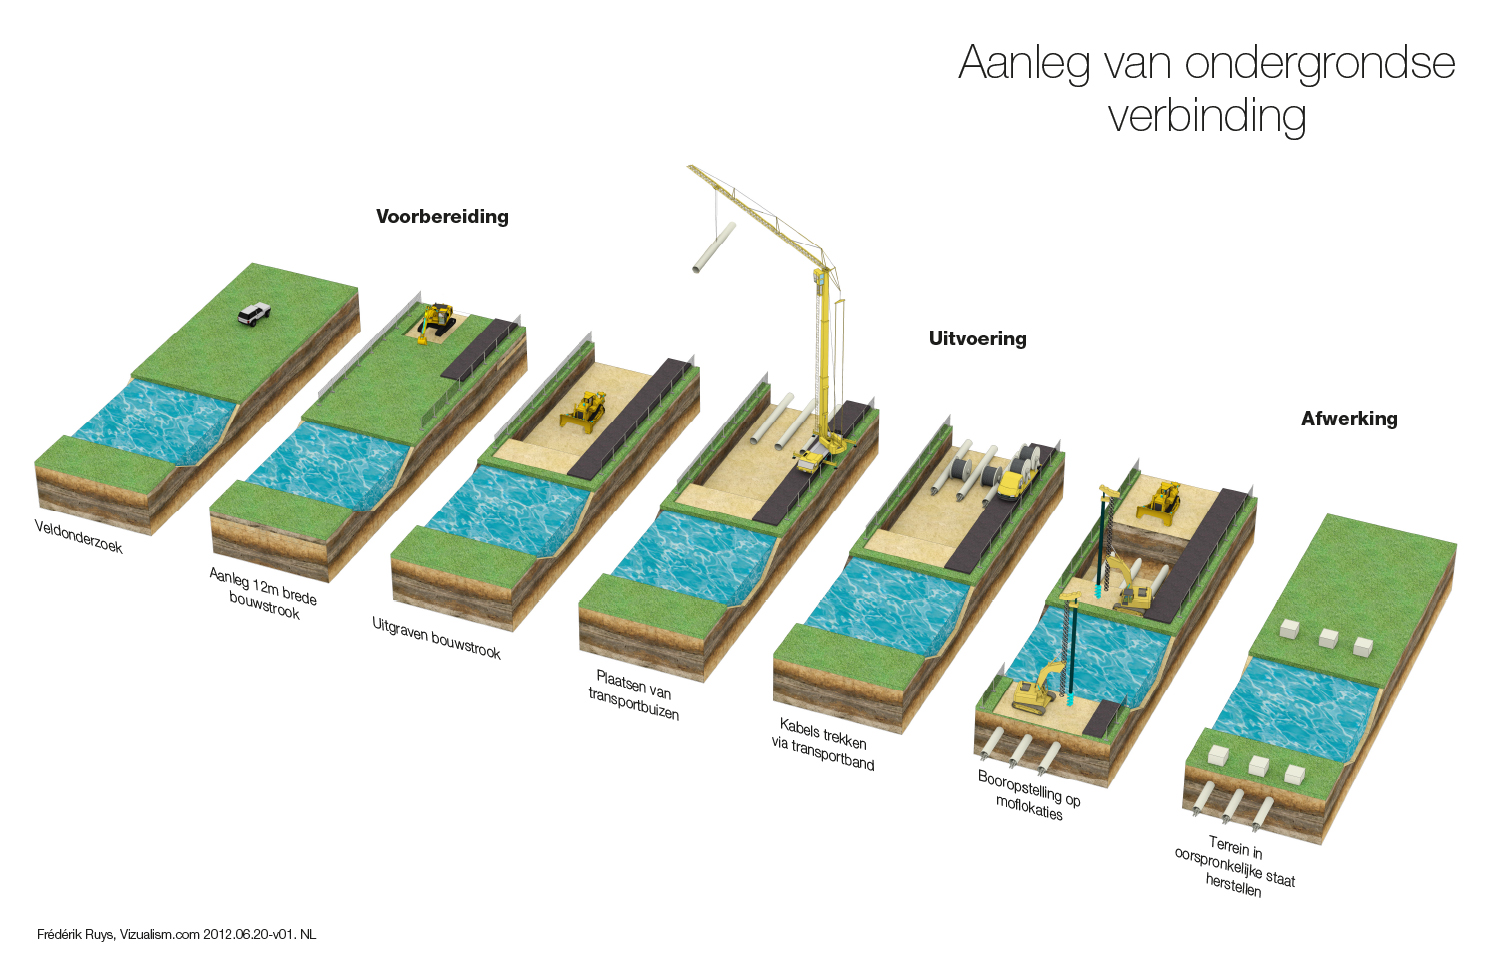
 Met de start van de bouw van het laatste ecoduct van de Veluwe (over de A348 bij Middachten), wenste de provincie Gelderland het netwerk aan flora- en faunapassages in beeld te brengen. Hiervoor ontwikkelden we voor hen een infographic die zij aan de pers ter publicatie konden aanbieden. En die toonde er vervolgens veel belangstelling voor – waaronder het NRC in hun uitgave van 15 september.
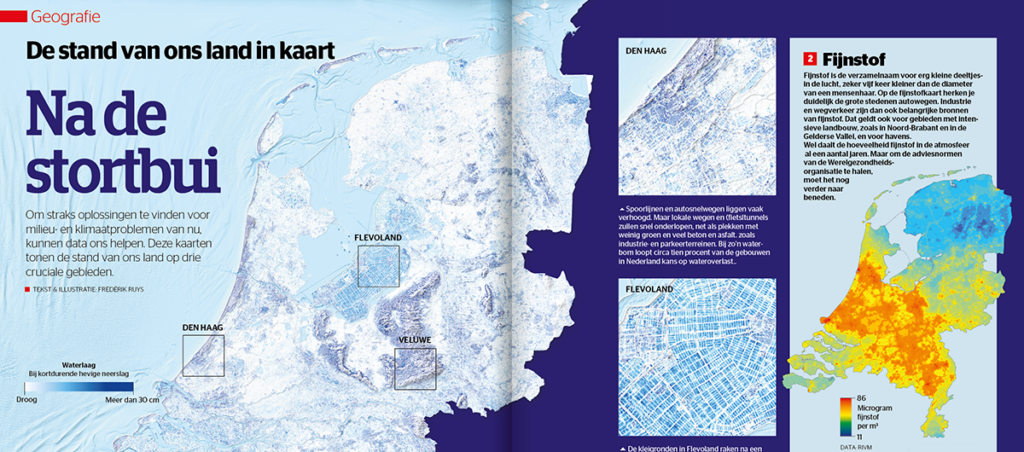
 De vpro-serie ‘Nederland van Boven’ is een ode aan het maakbare Nederland. Door middel van datavisualisaties, indrukwekkende luchtbeelden en portretten van helden op de grond laten we zien wie we zijn en hoe onze mentaliteit ons land gevormd heeft. Booklet bij de DVD.
.embed-container { position: relative; padding-bottom: 56.25%; height: 0; overflow: hidden; max-width: 100%; } .embed-container iframe, .embed-container object, .embed-container embed { position: absolute; top: 0; left: 0; width: 100%; height: 100%; }
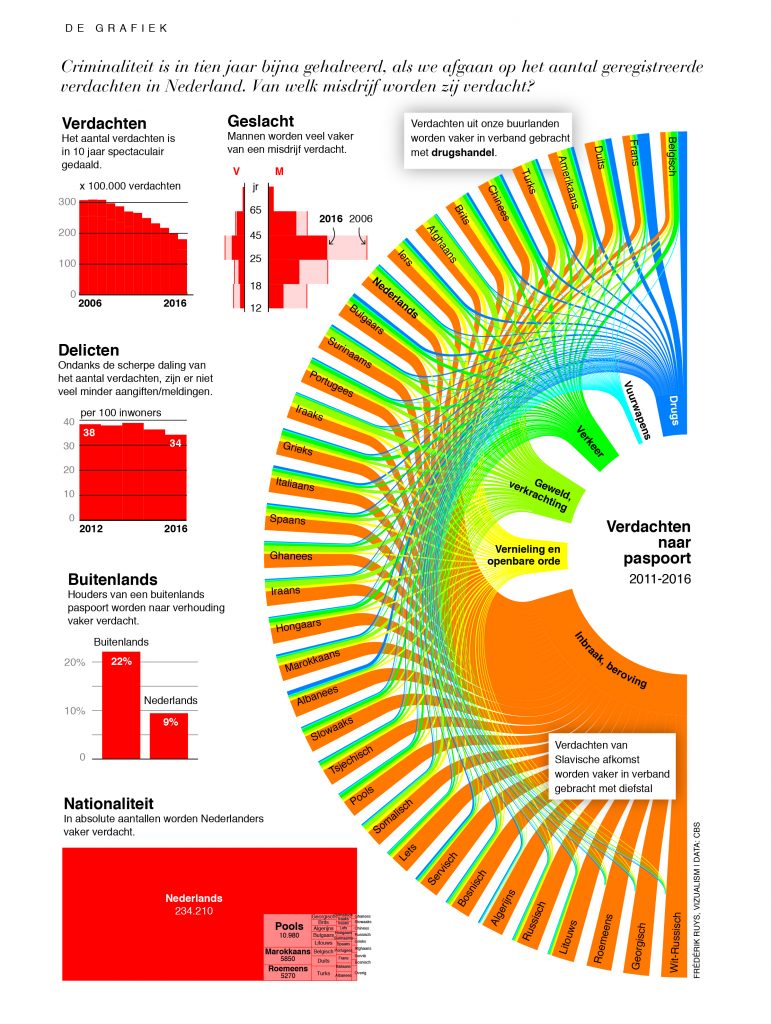
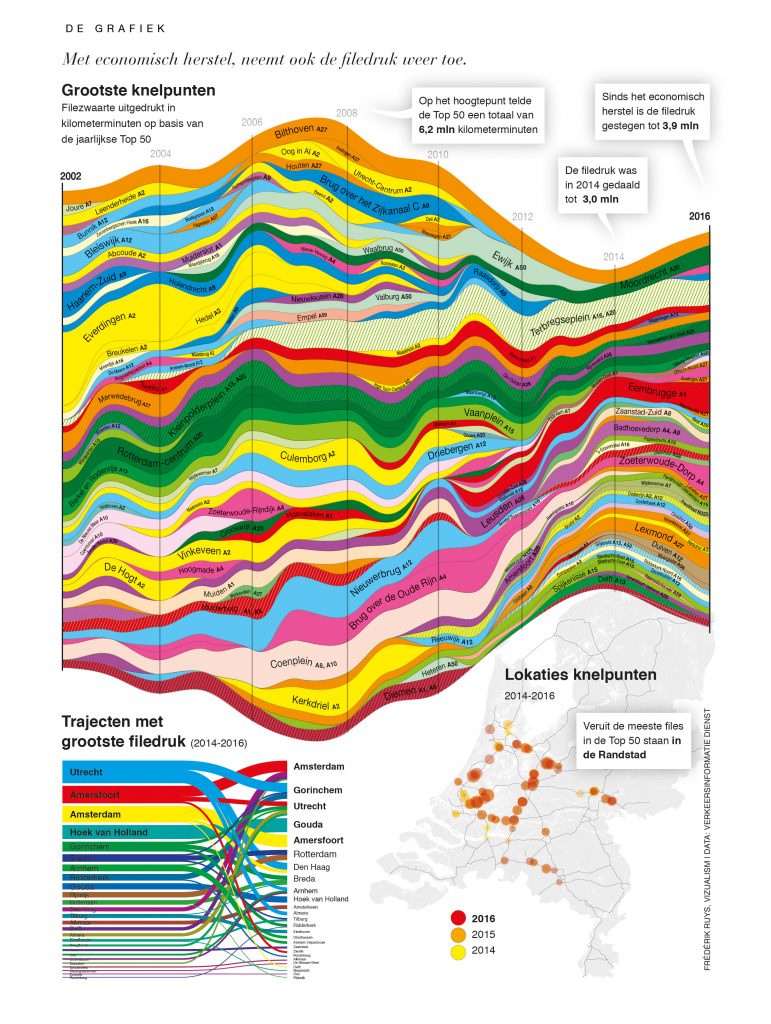
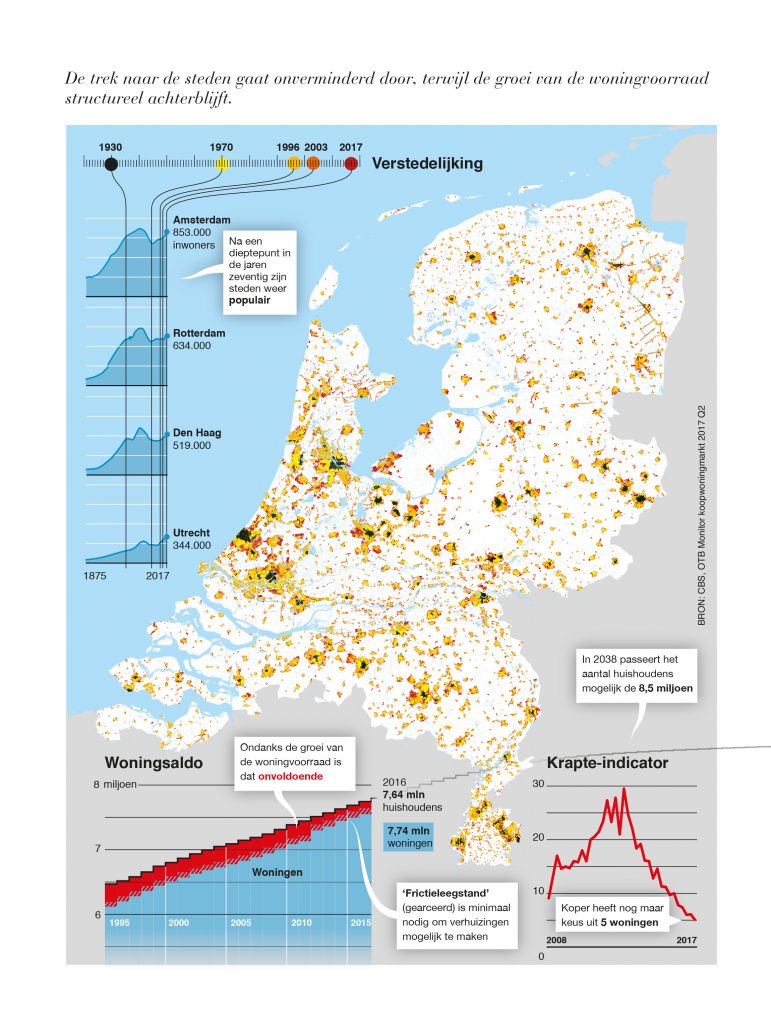
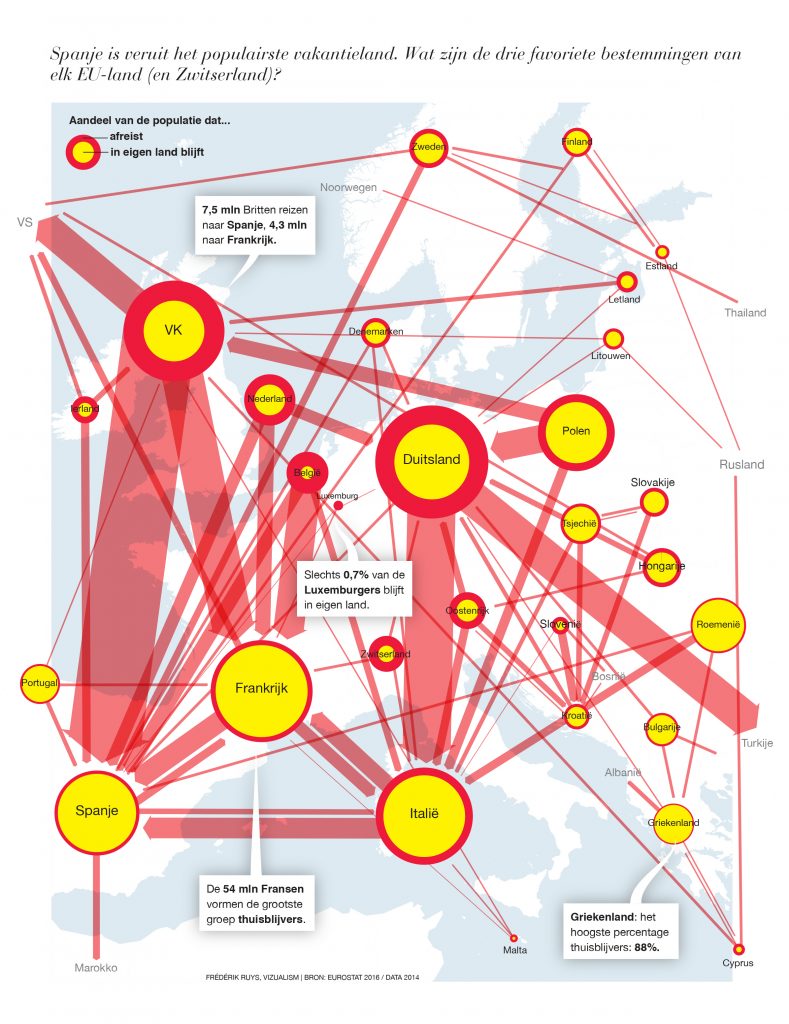
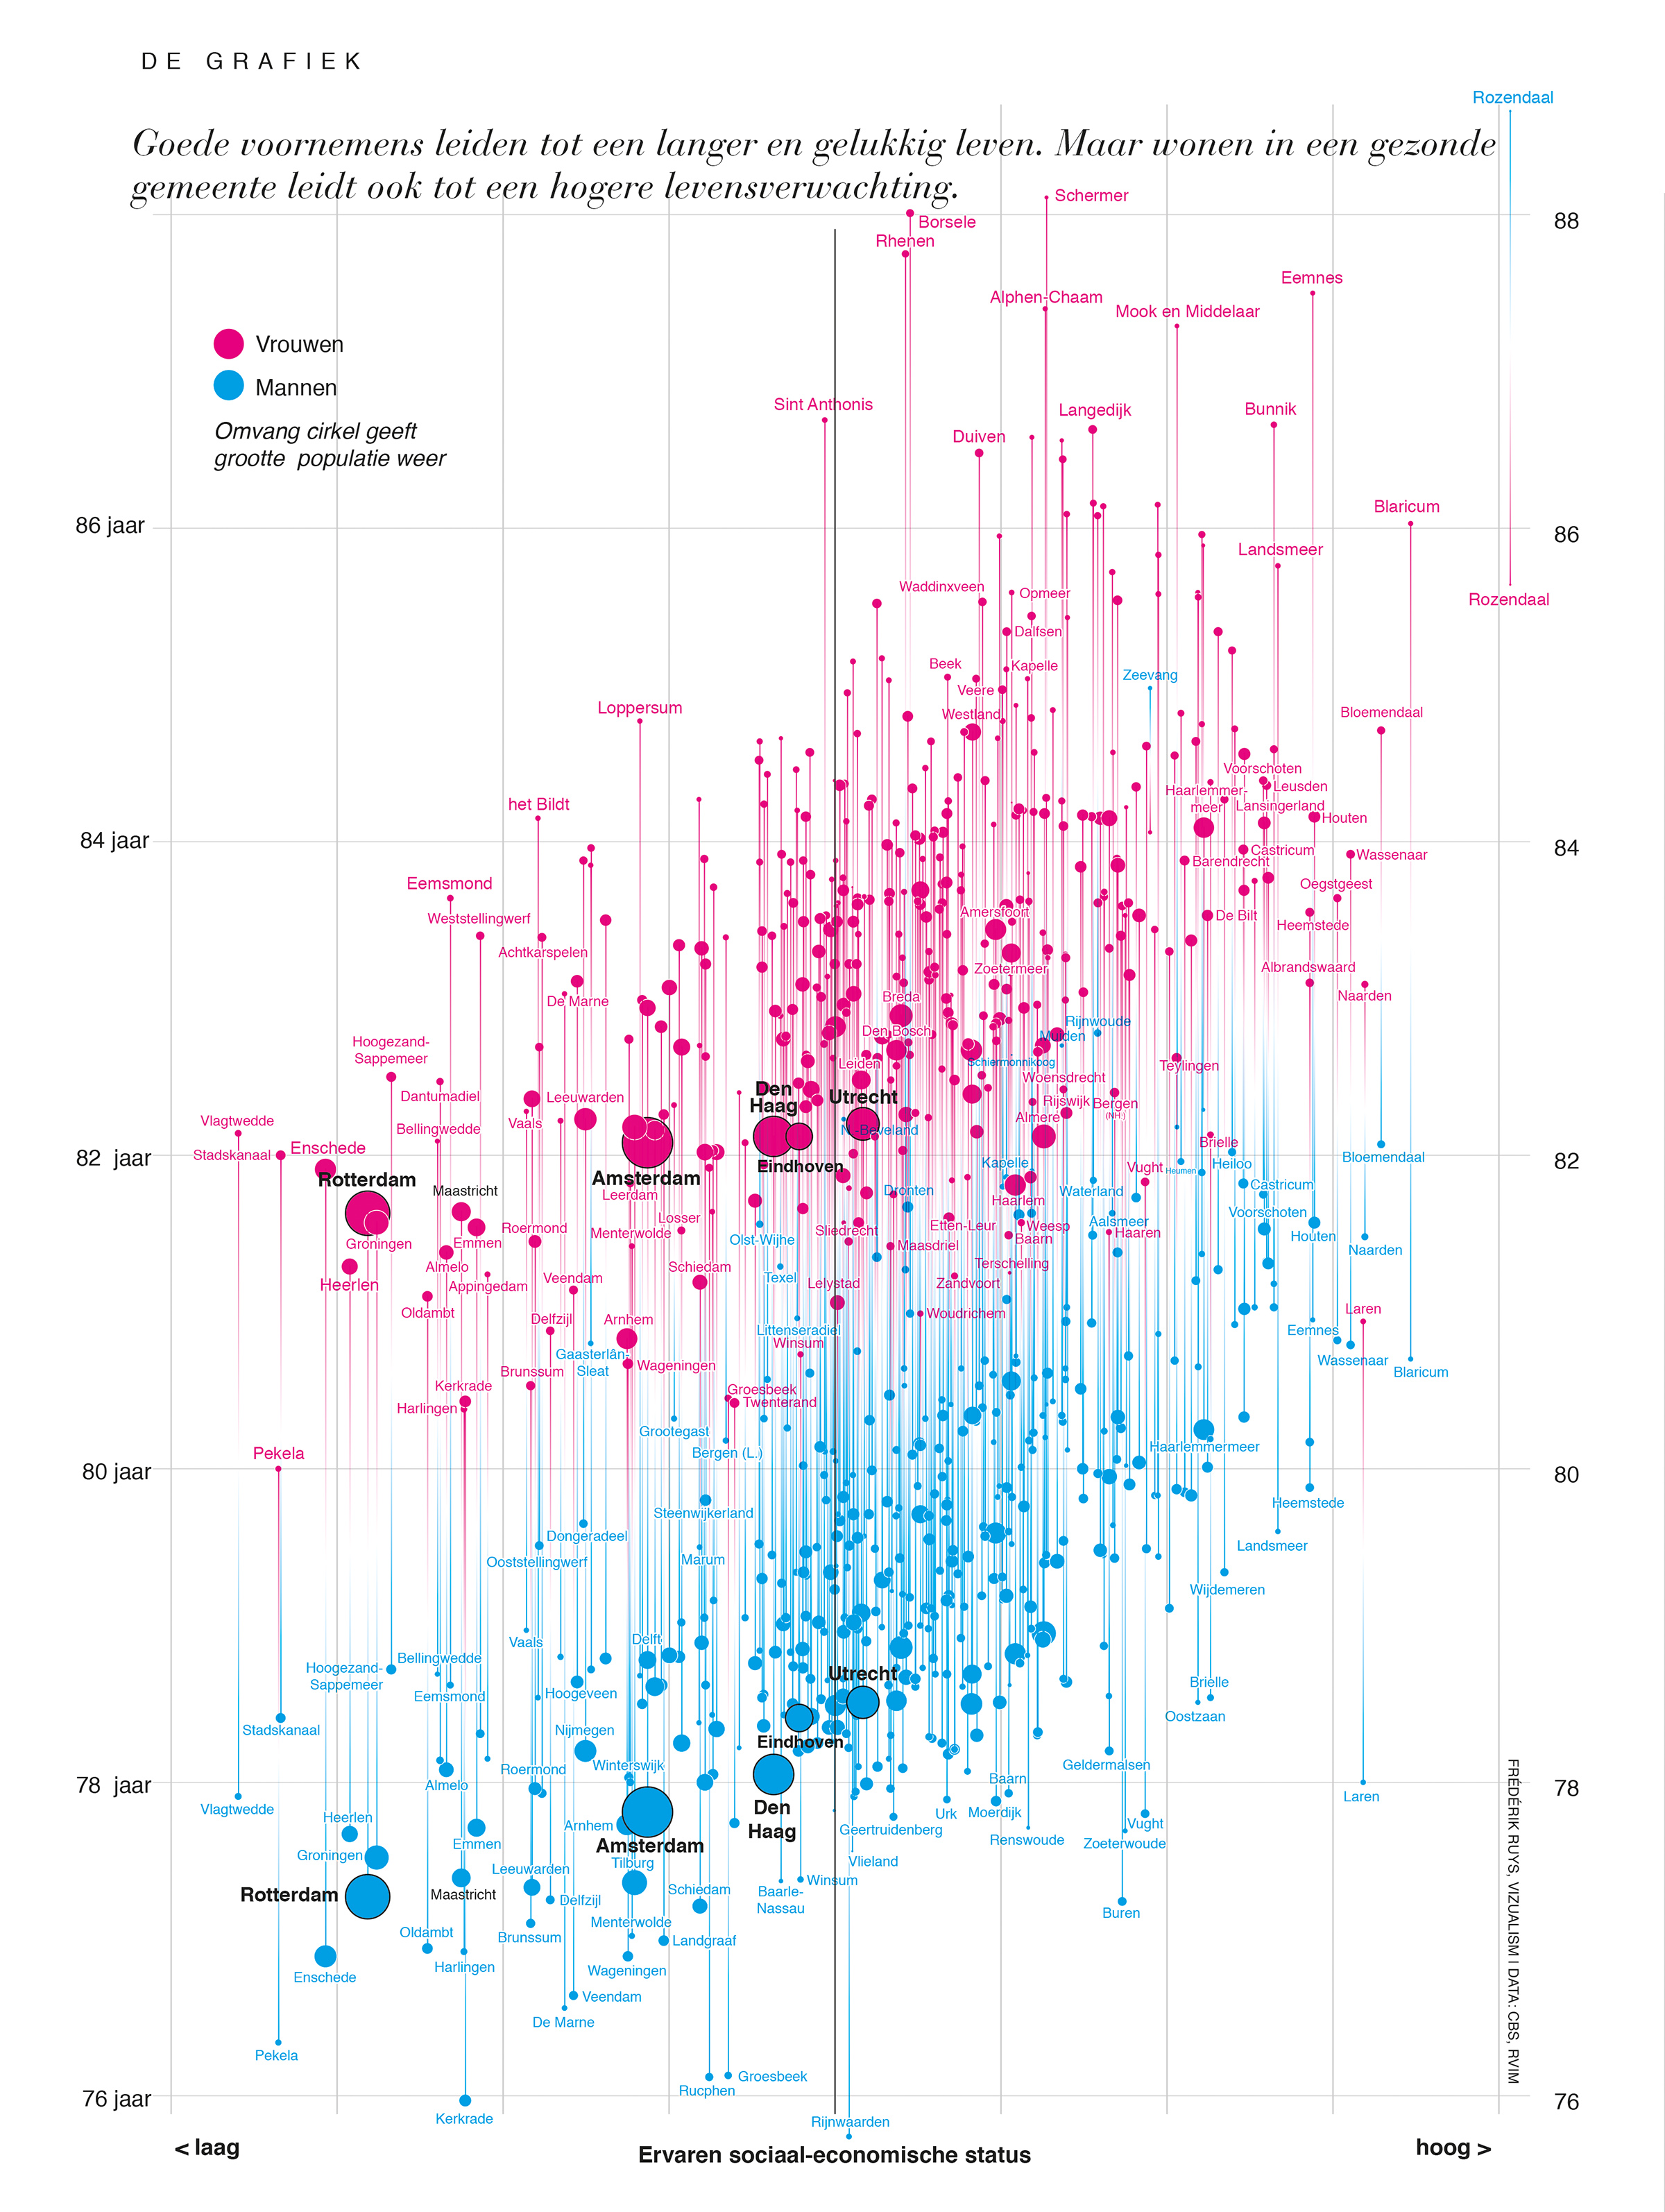
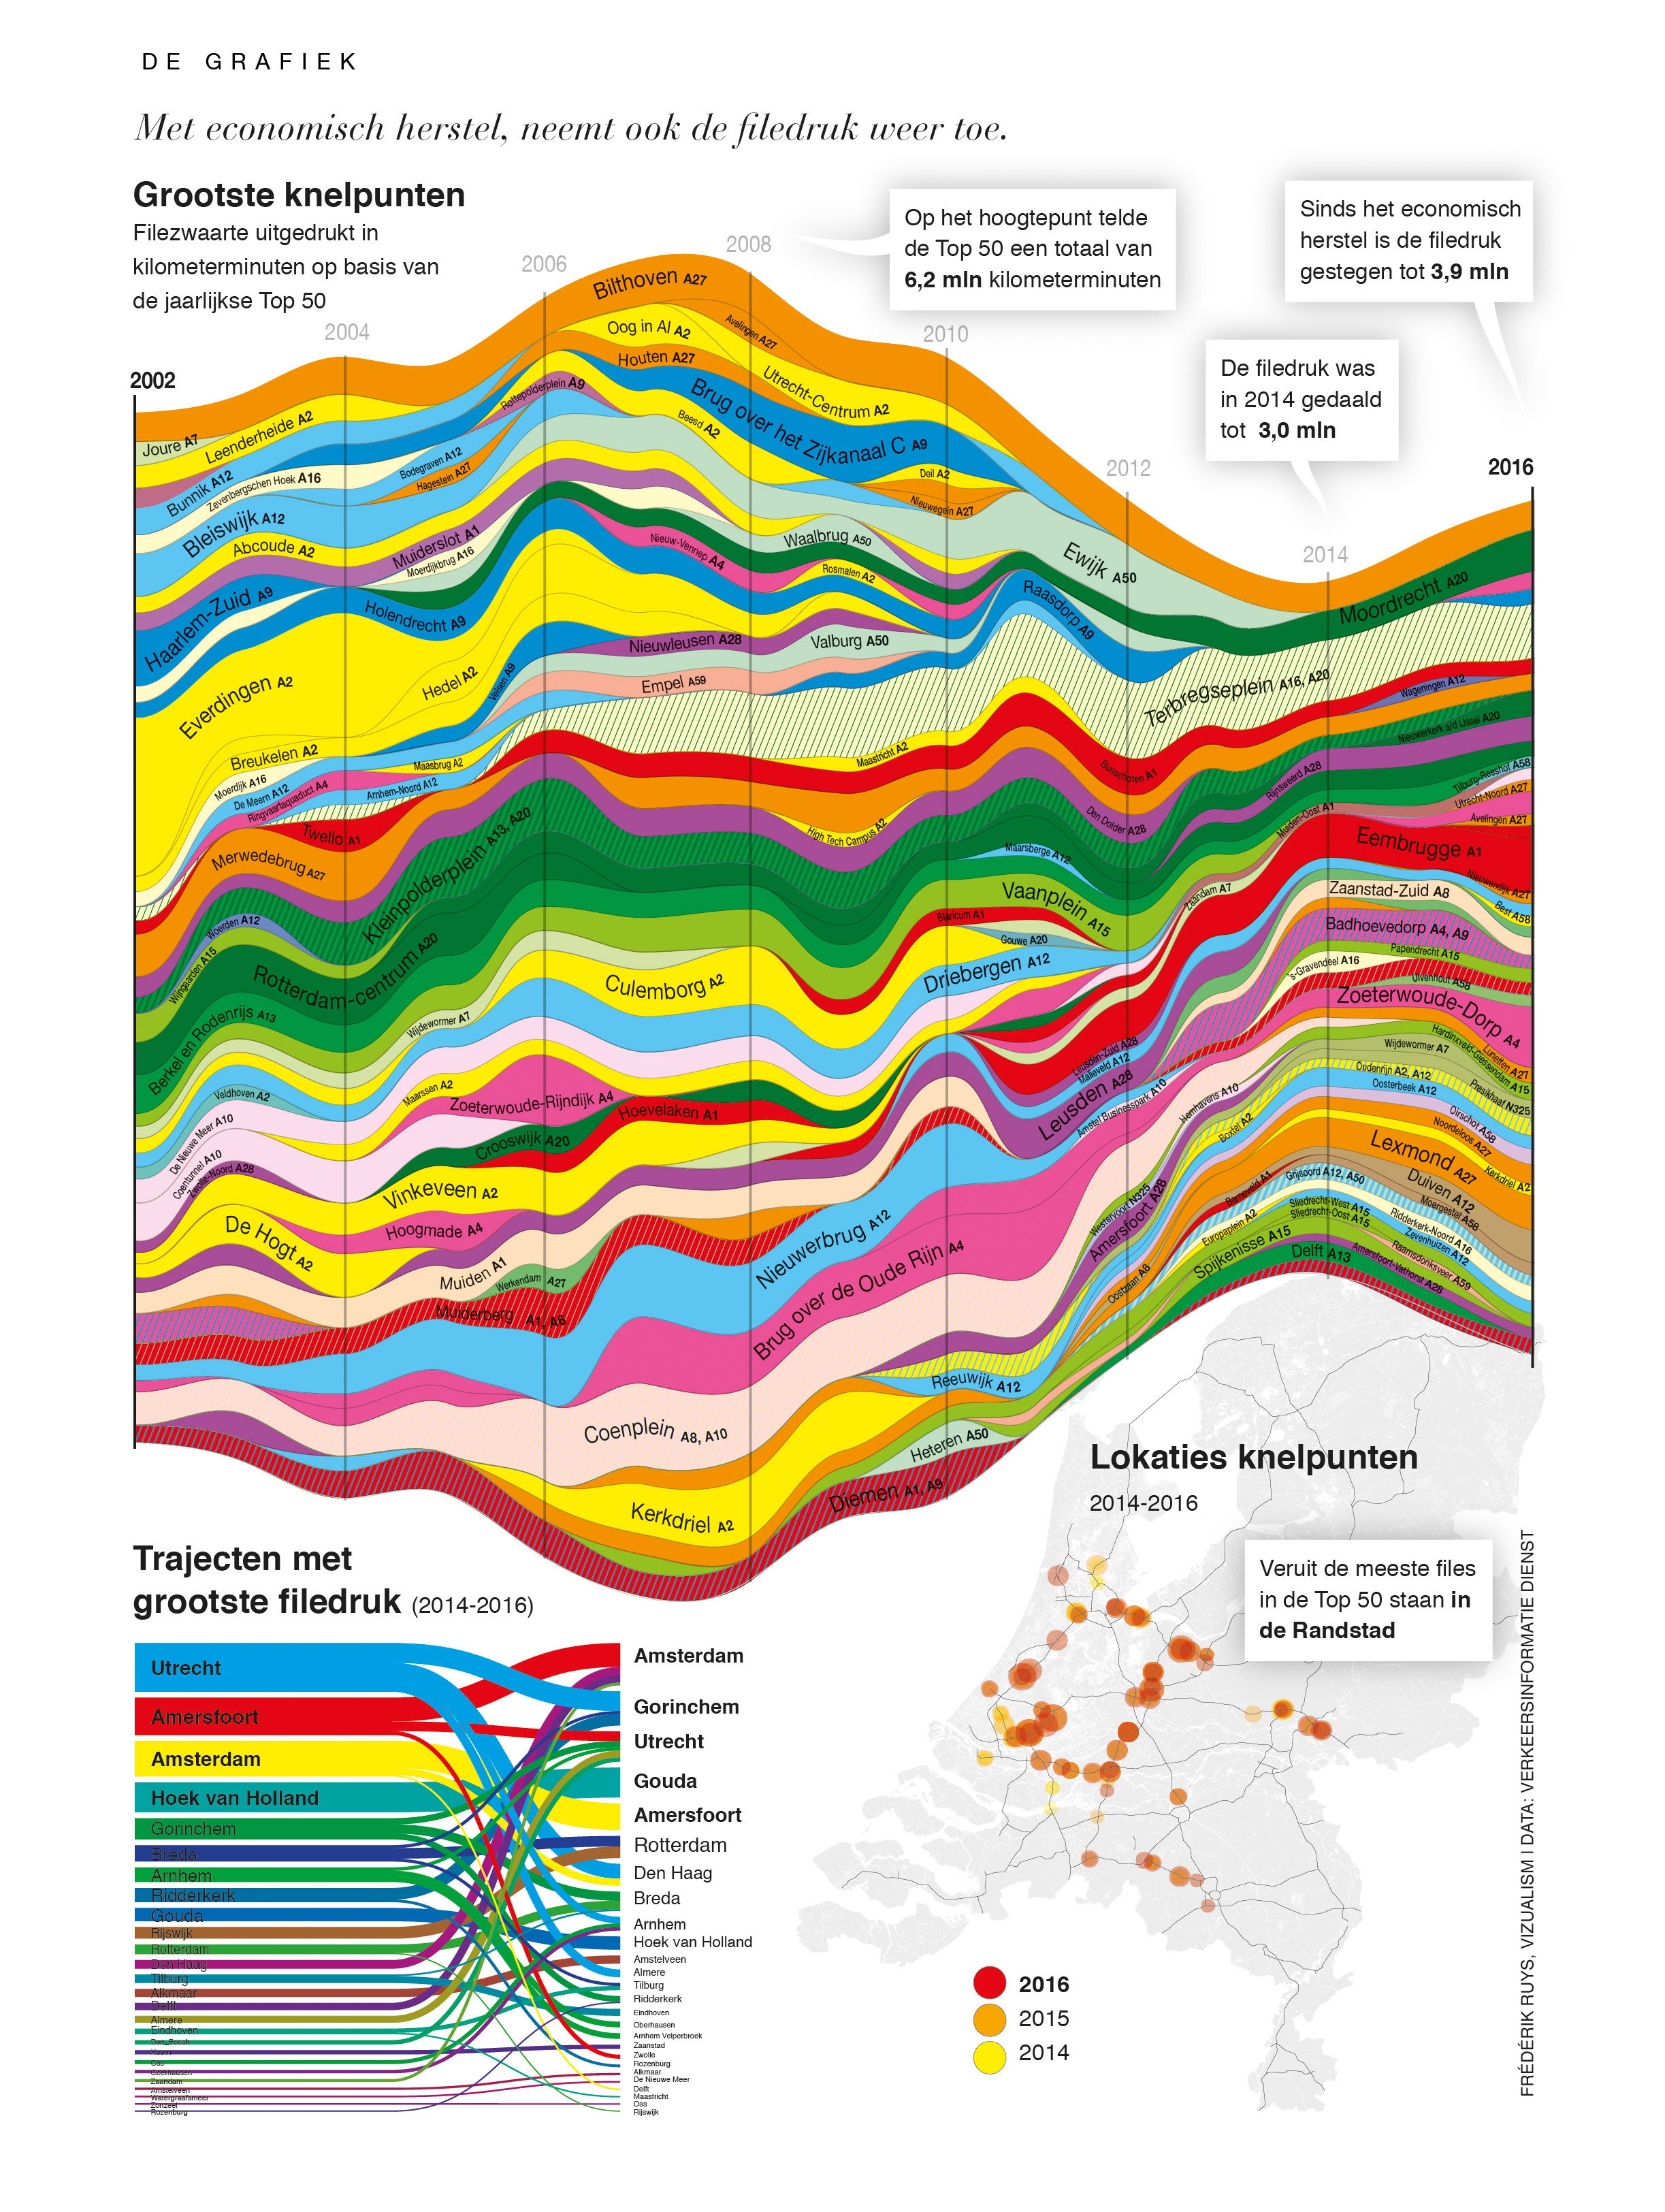
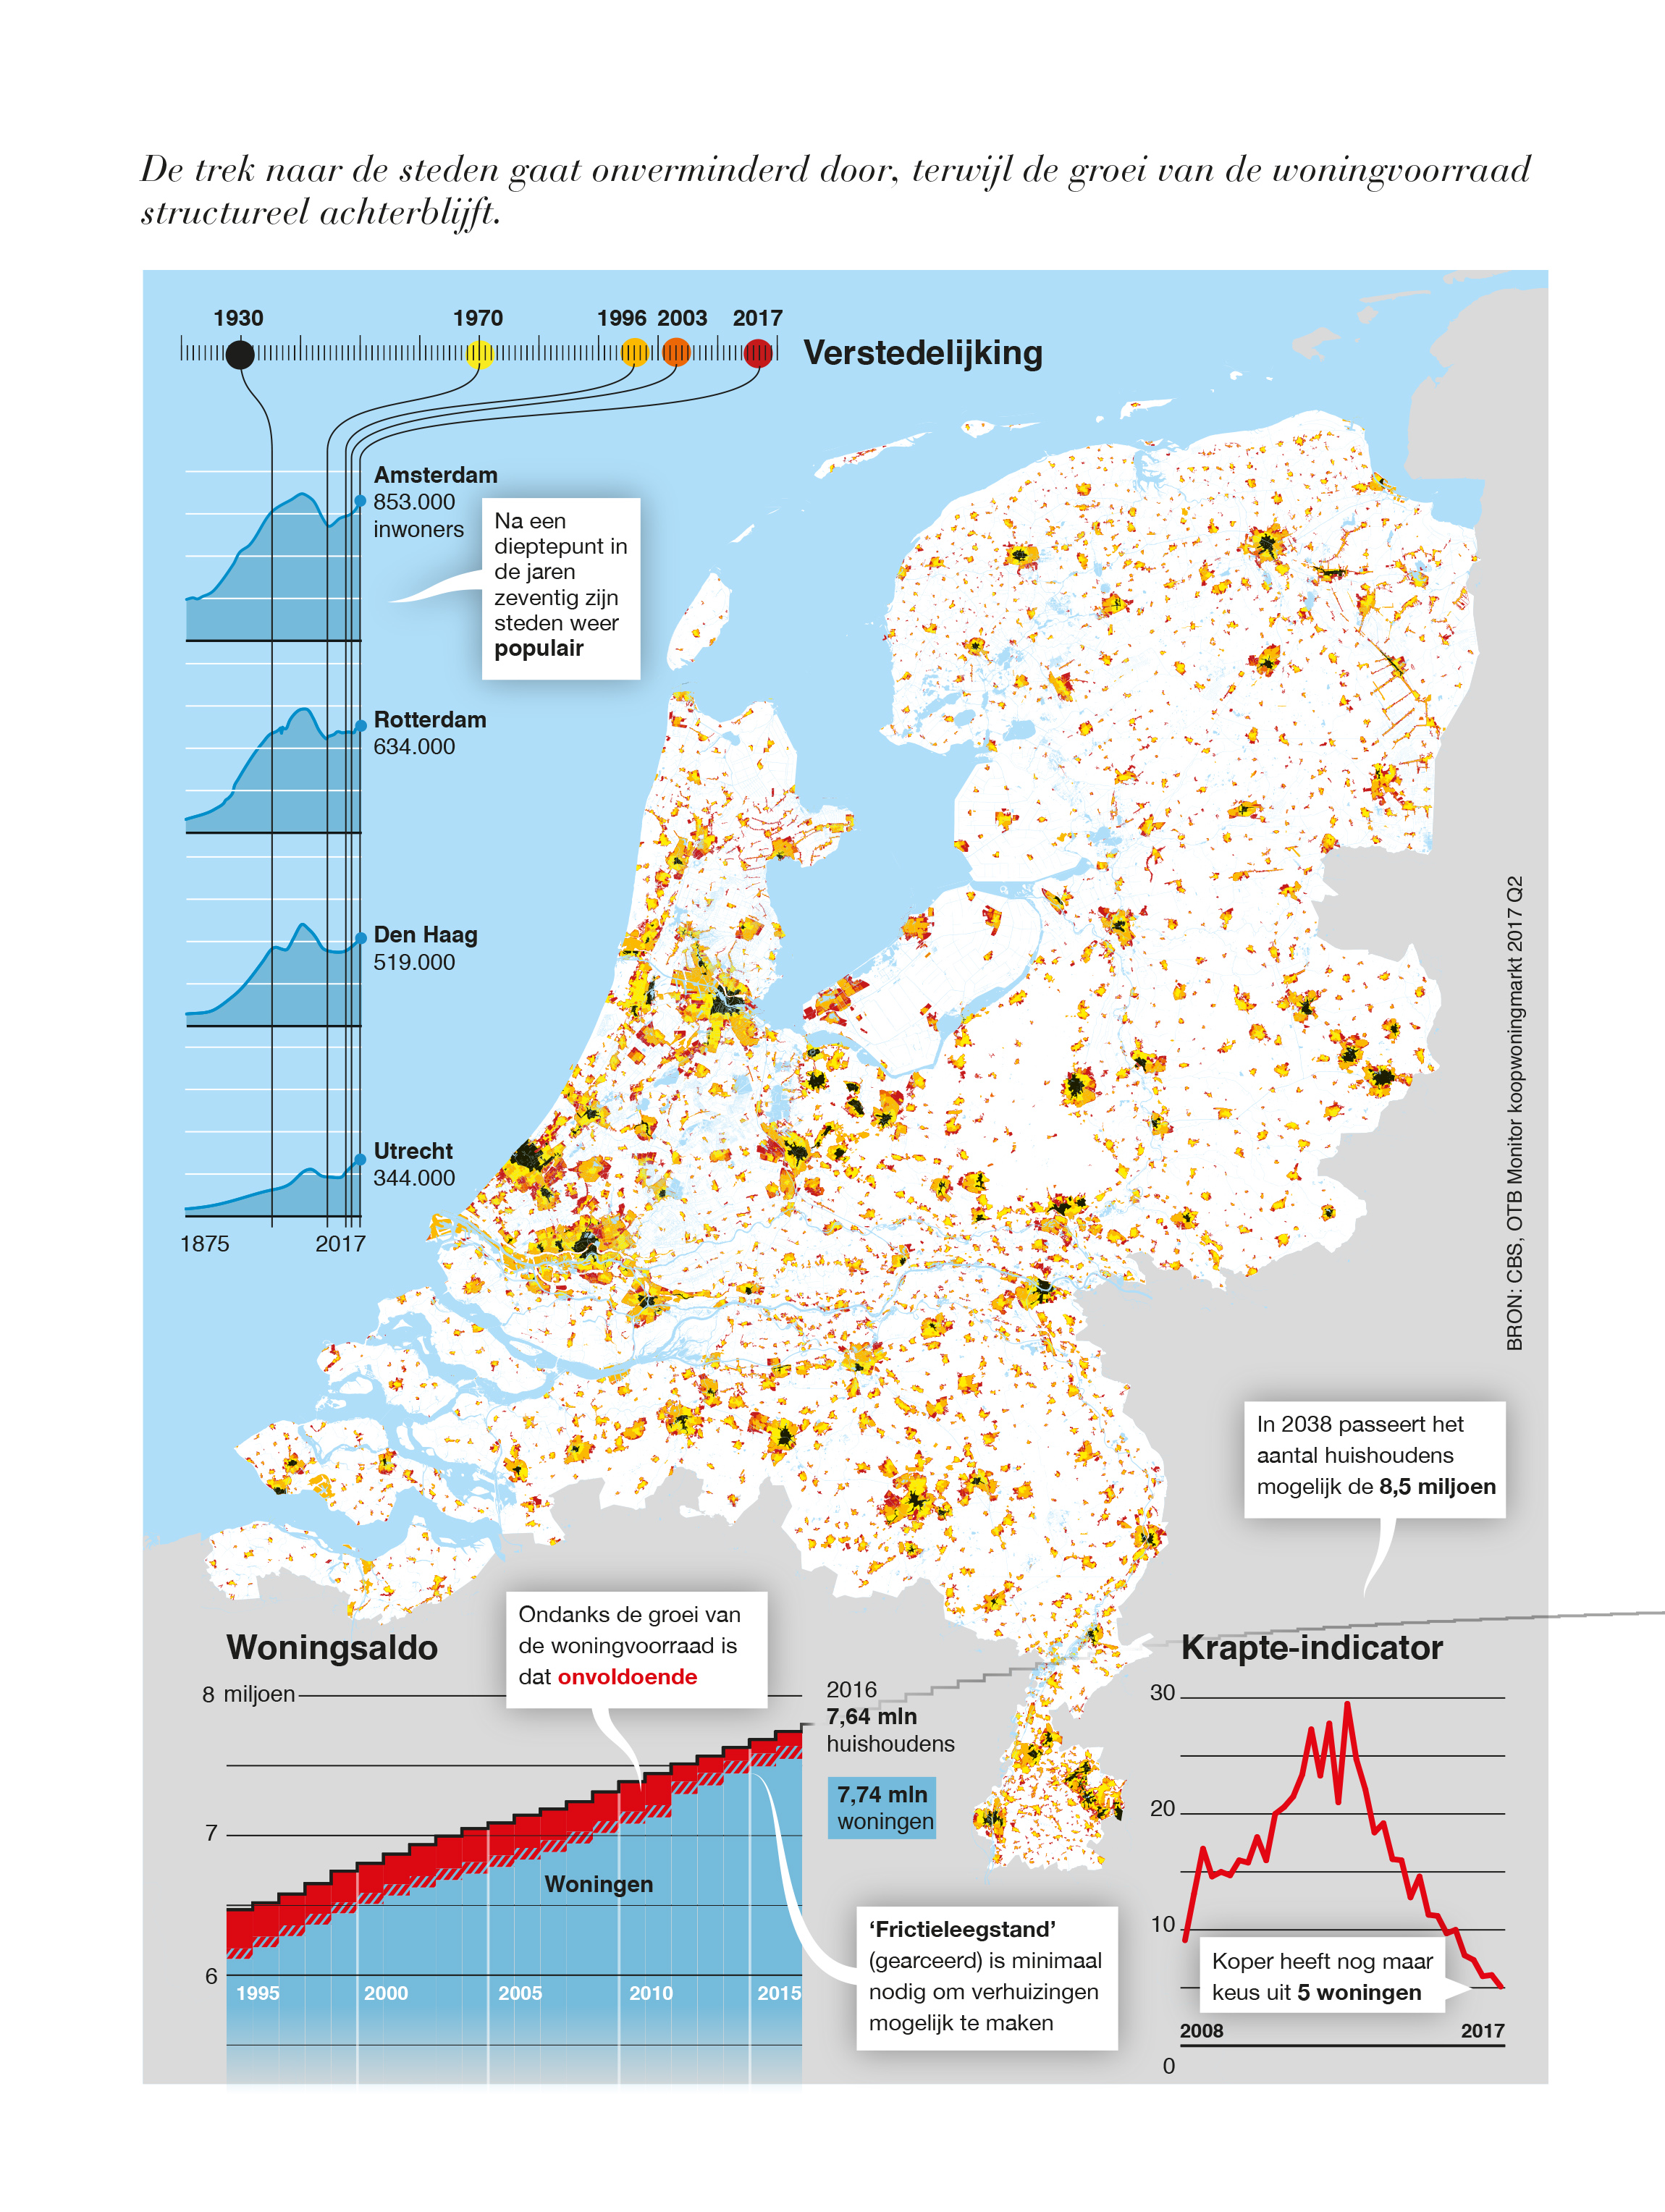
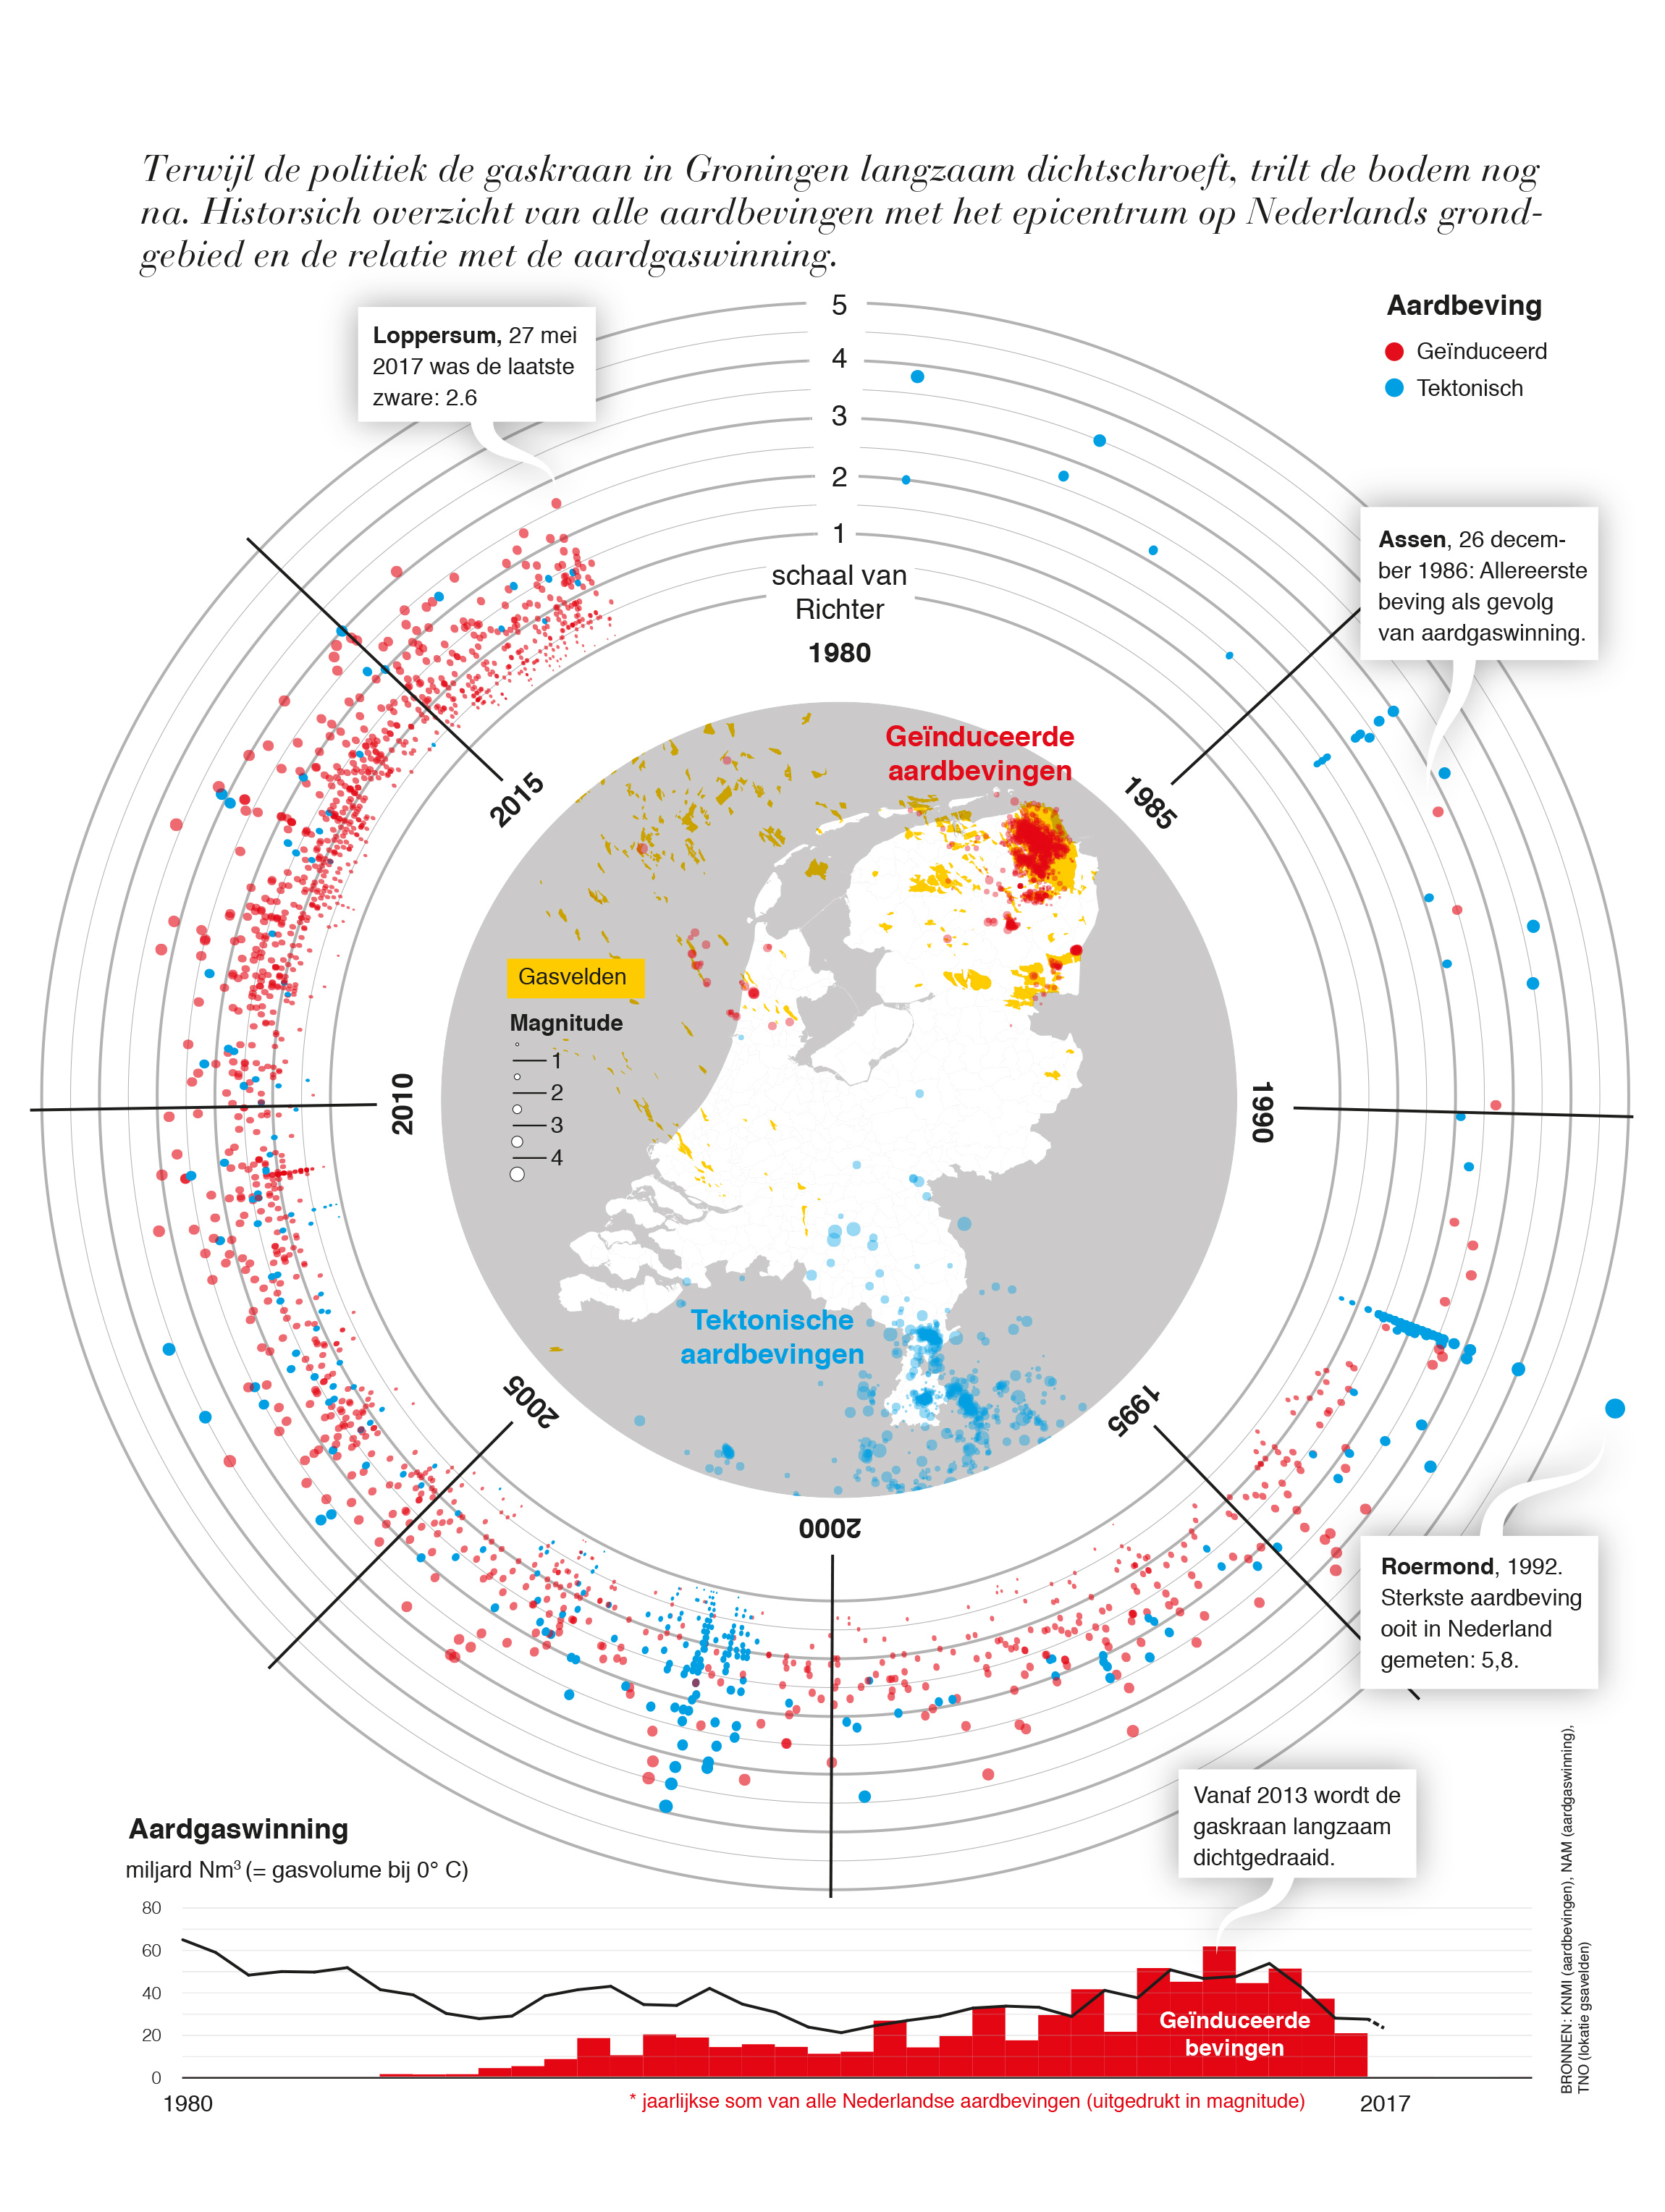
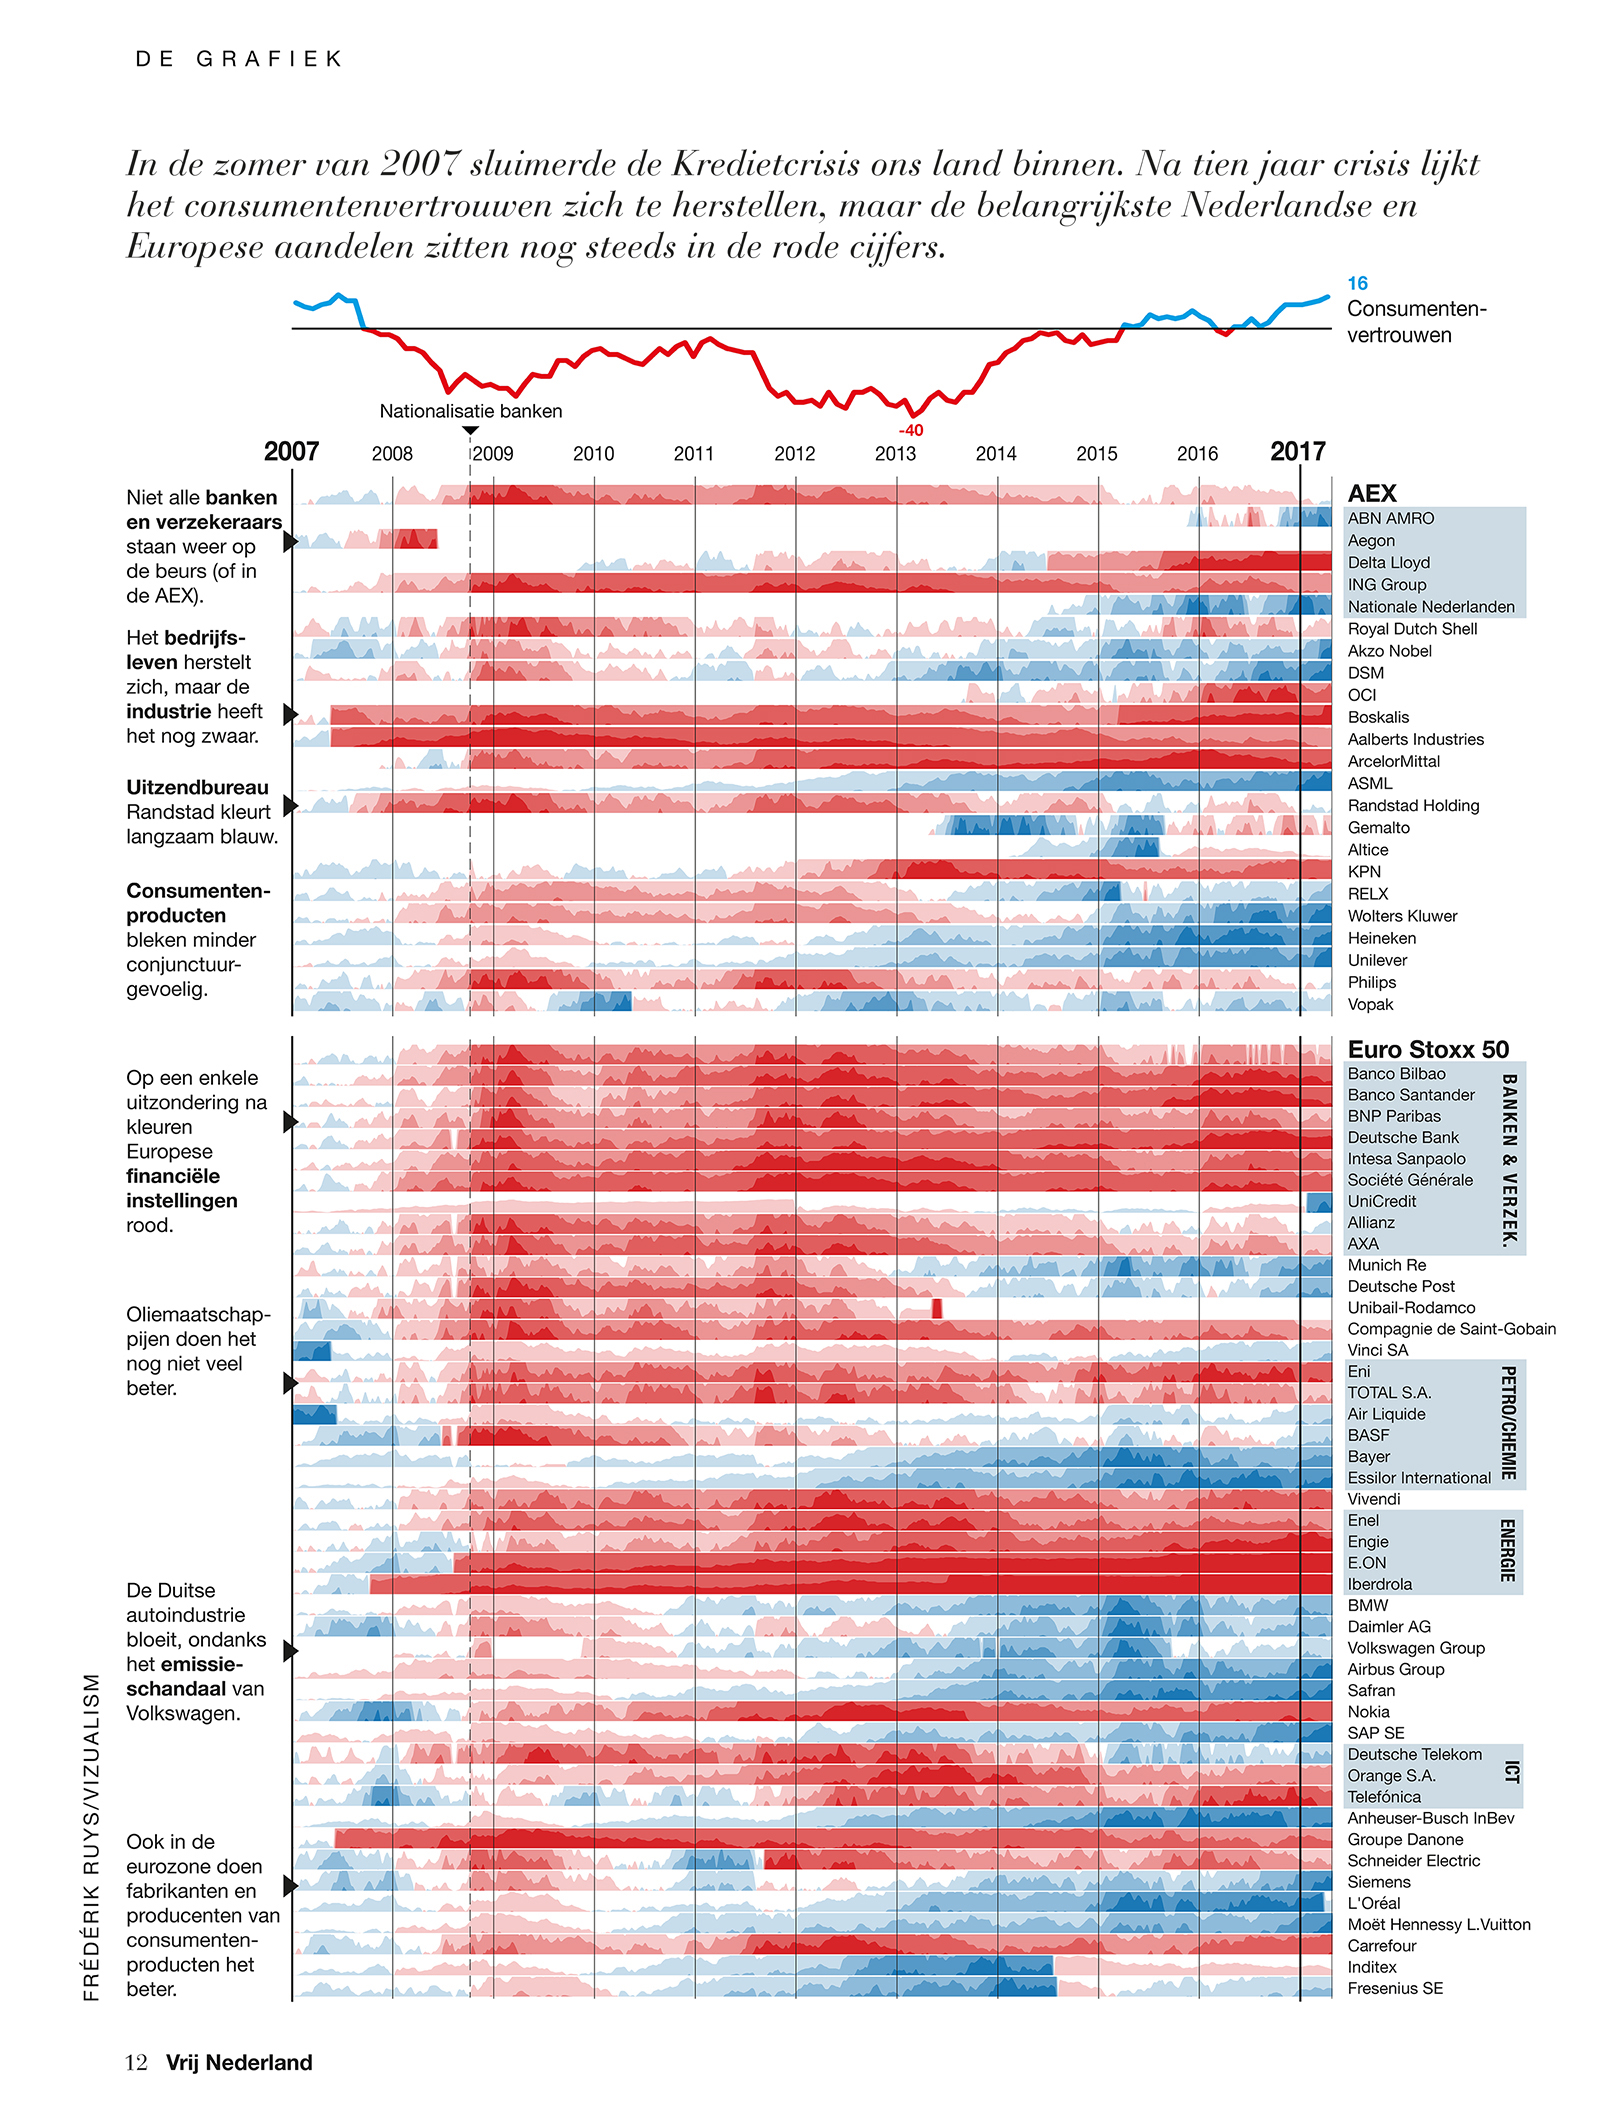
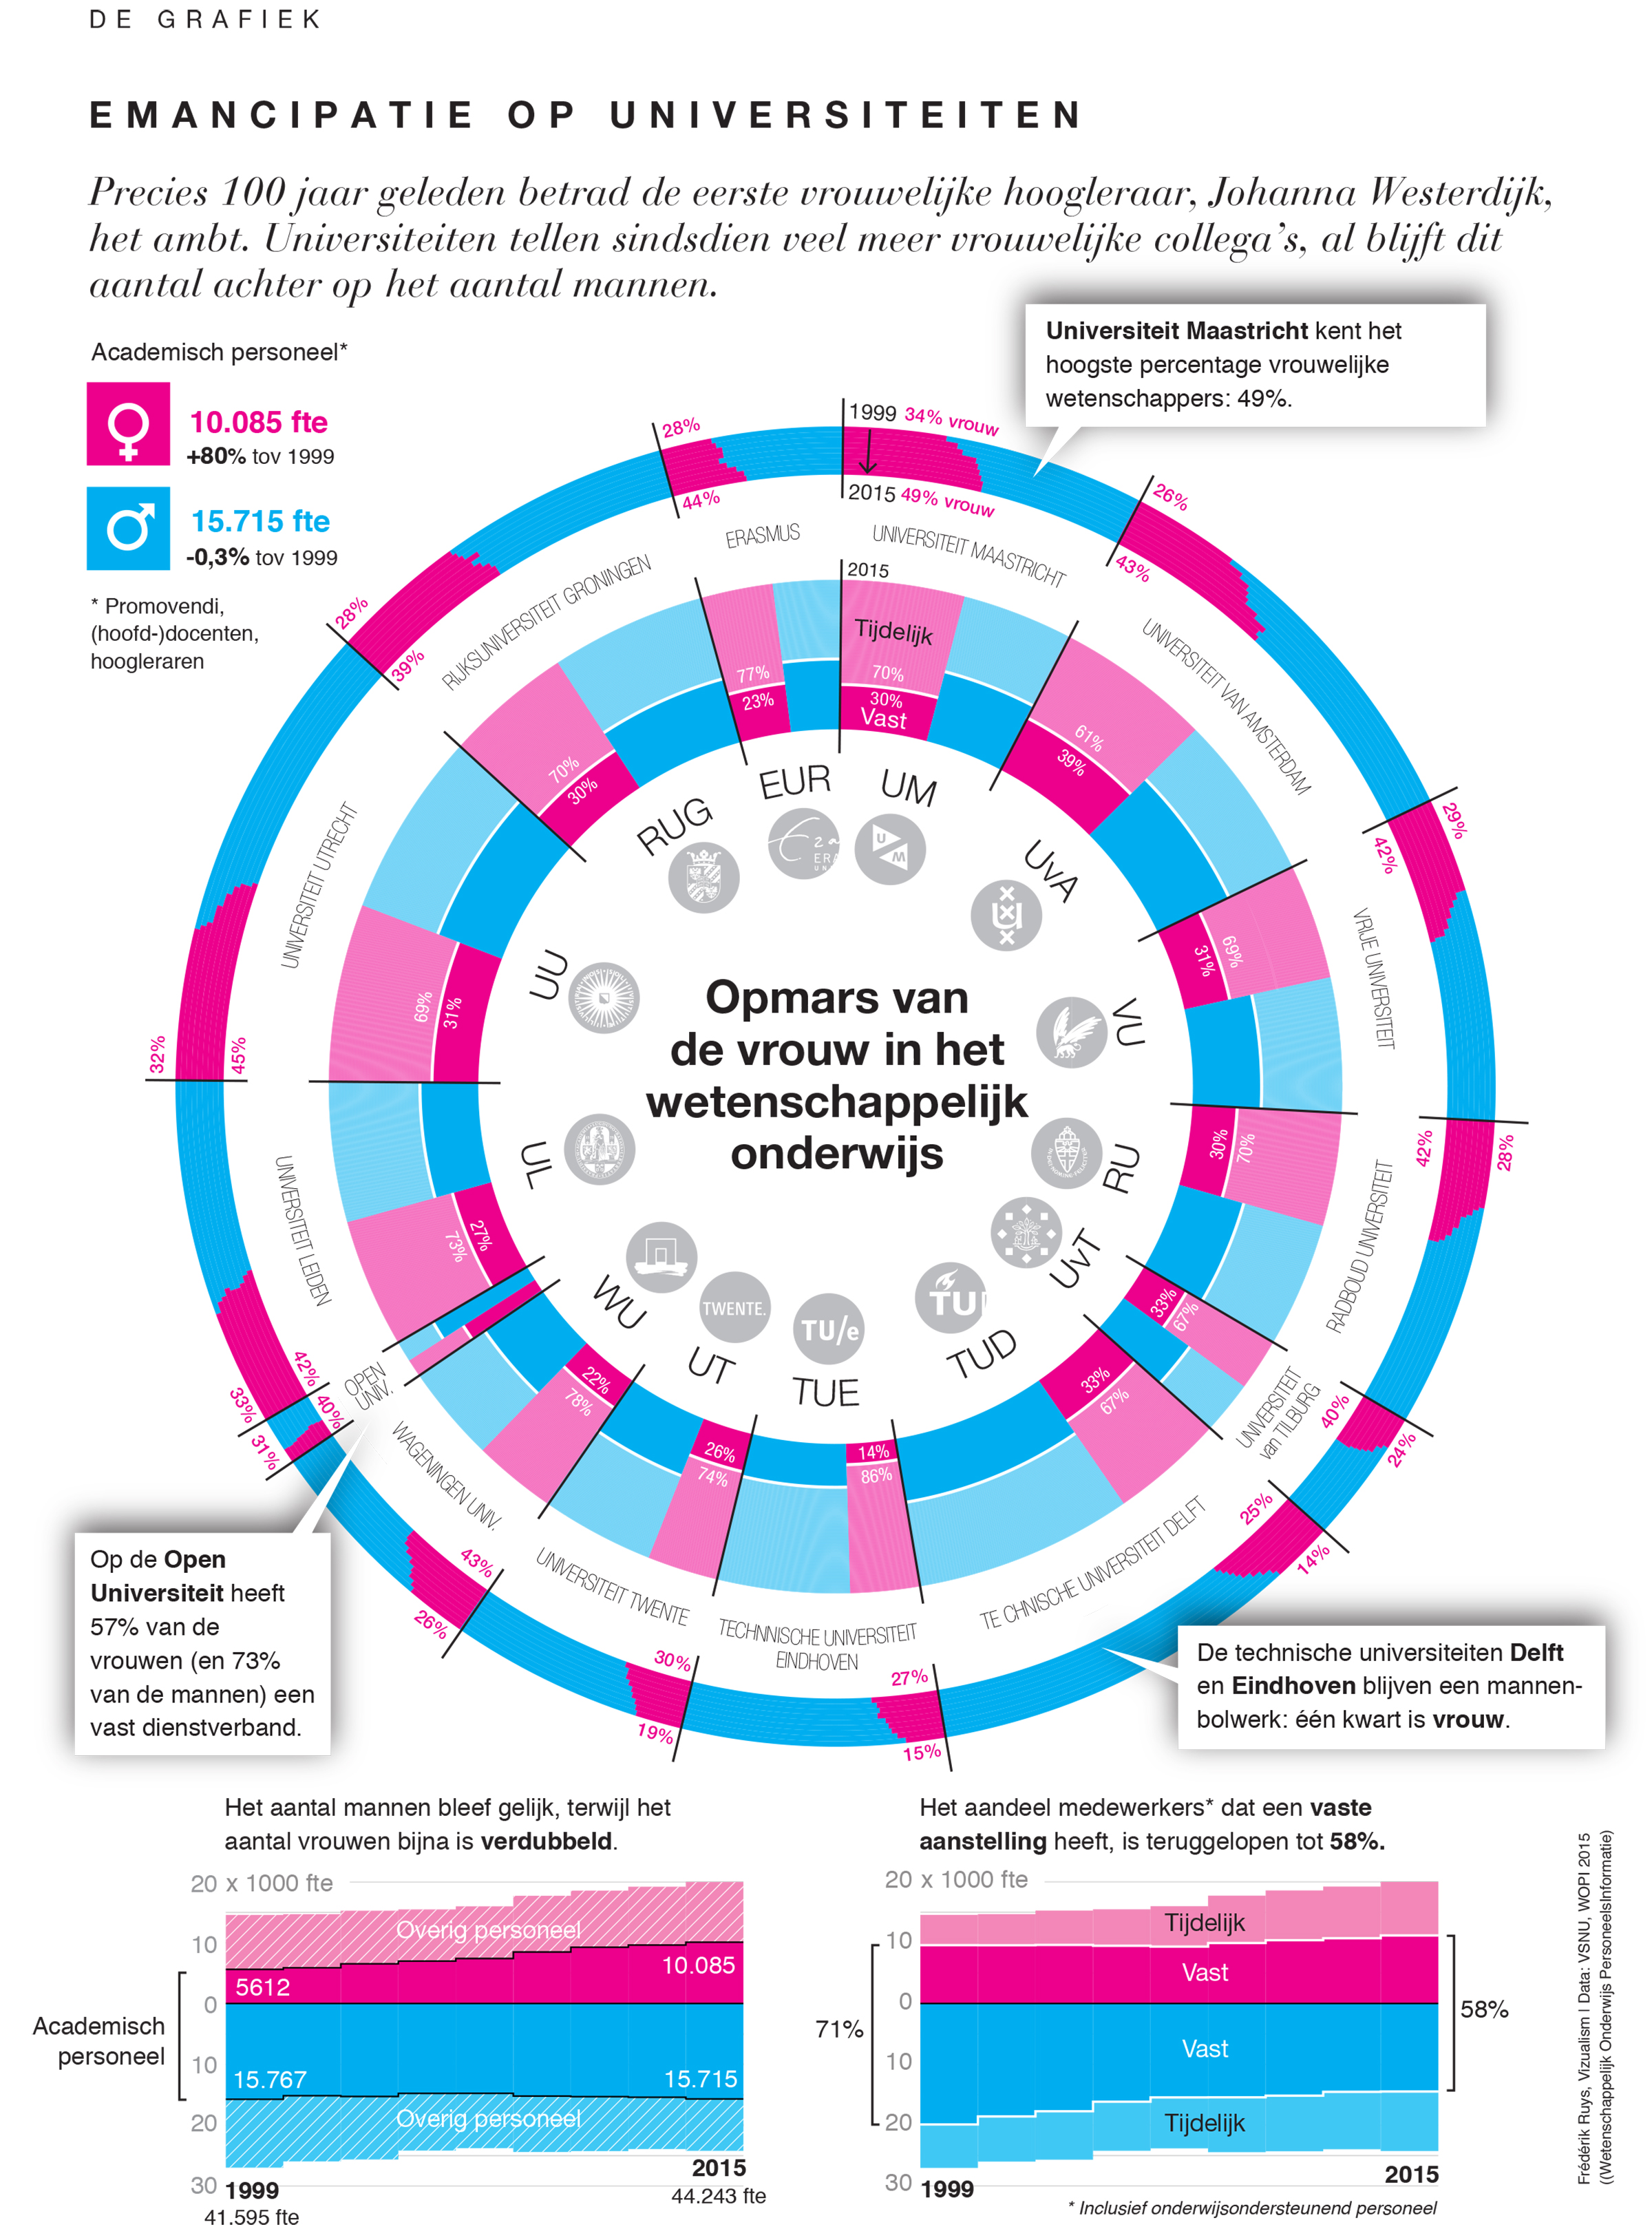
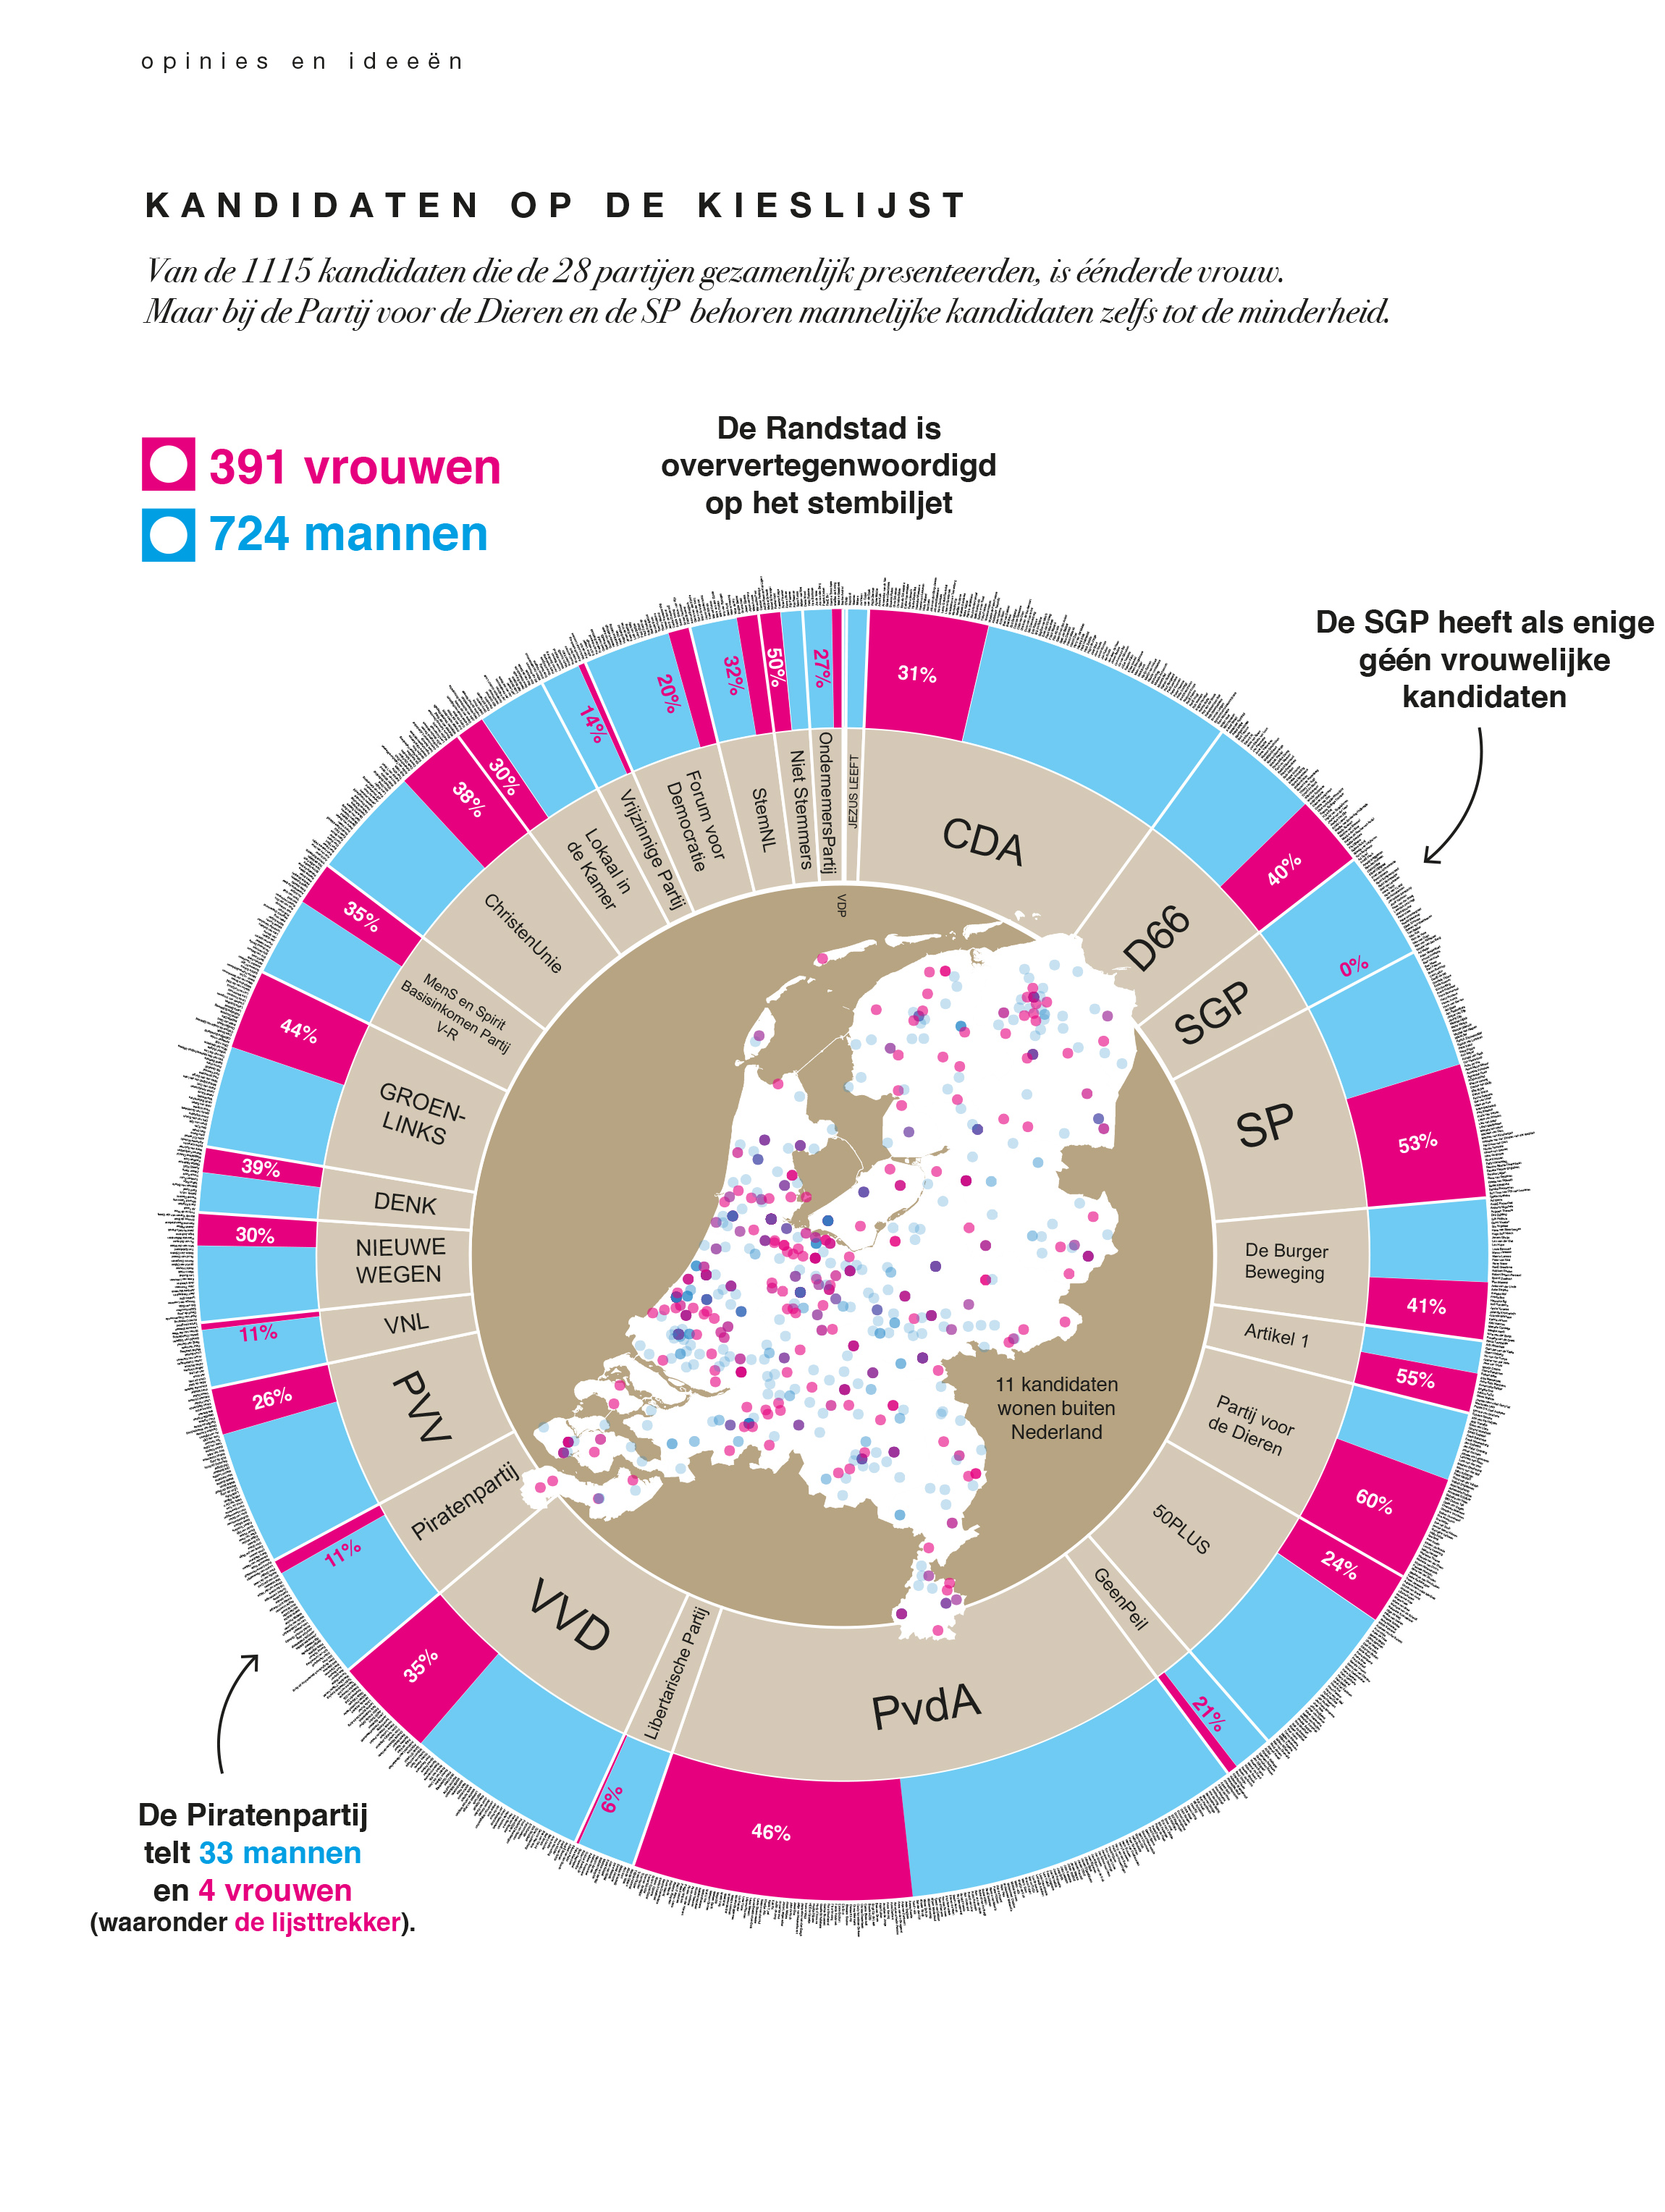
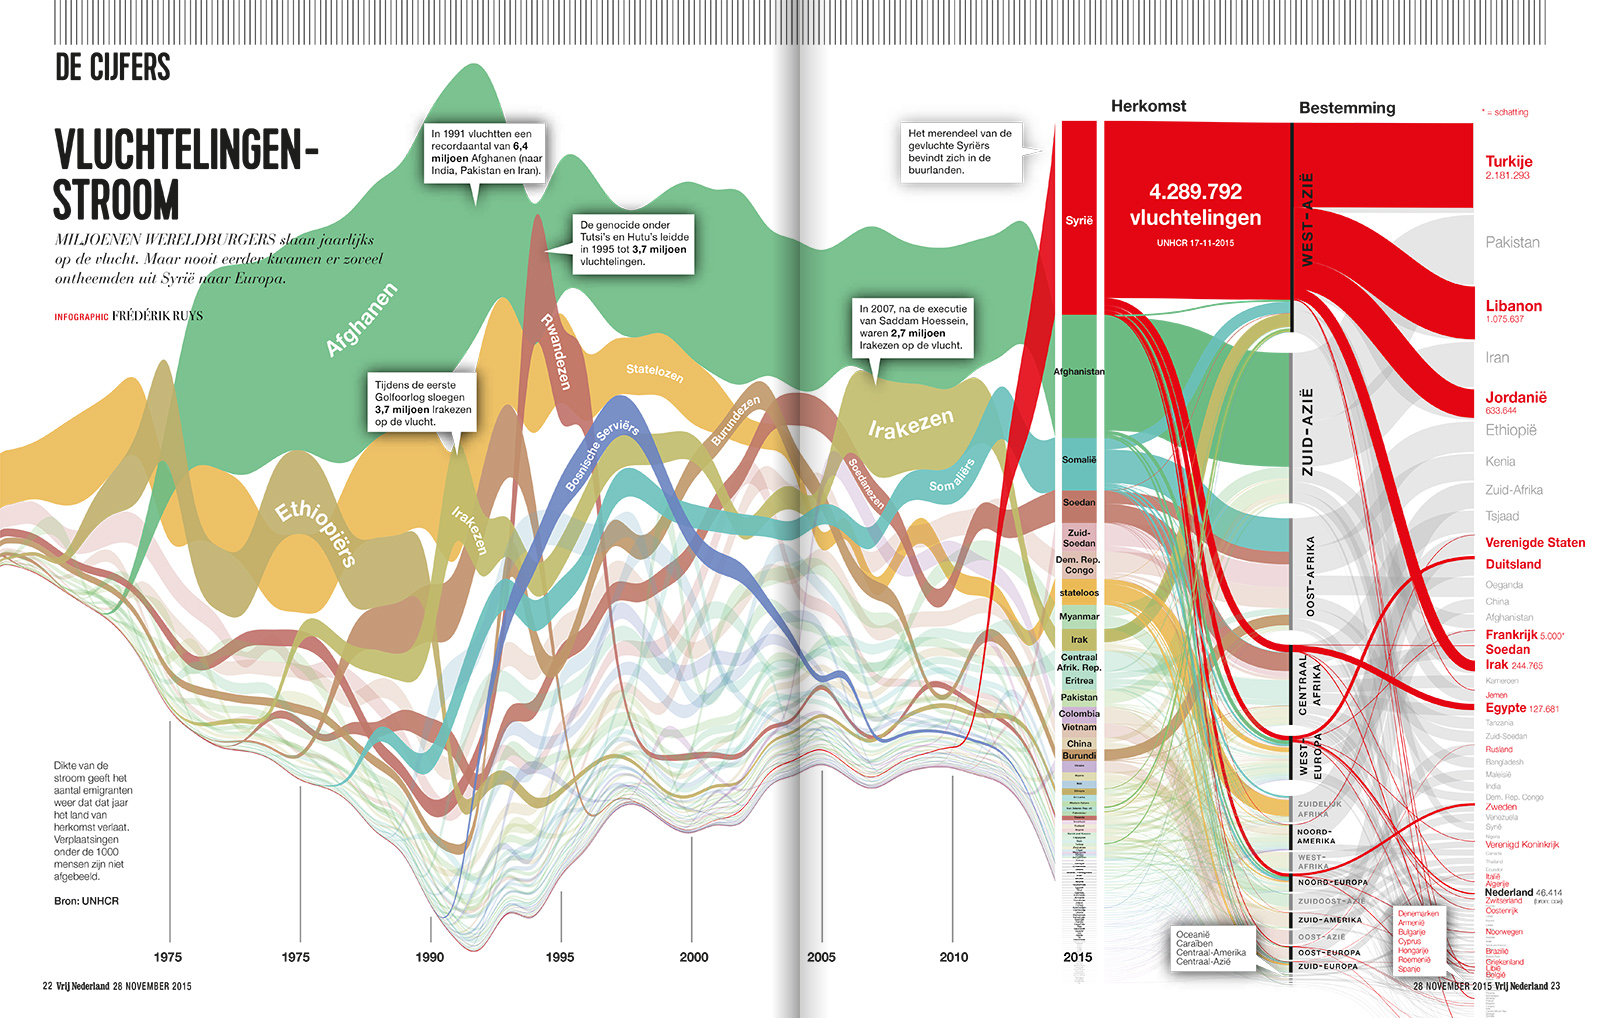
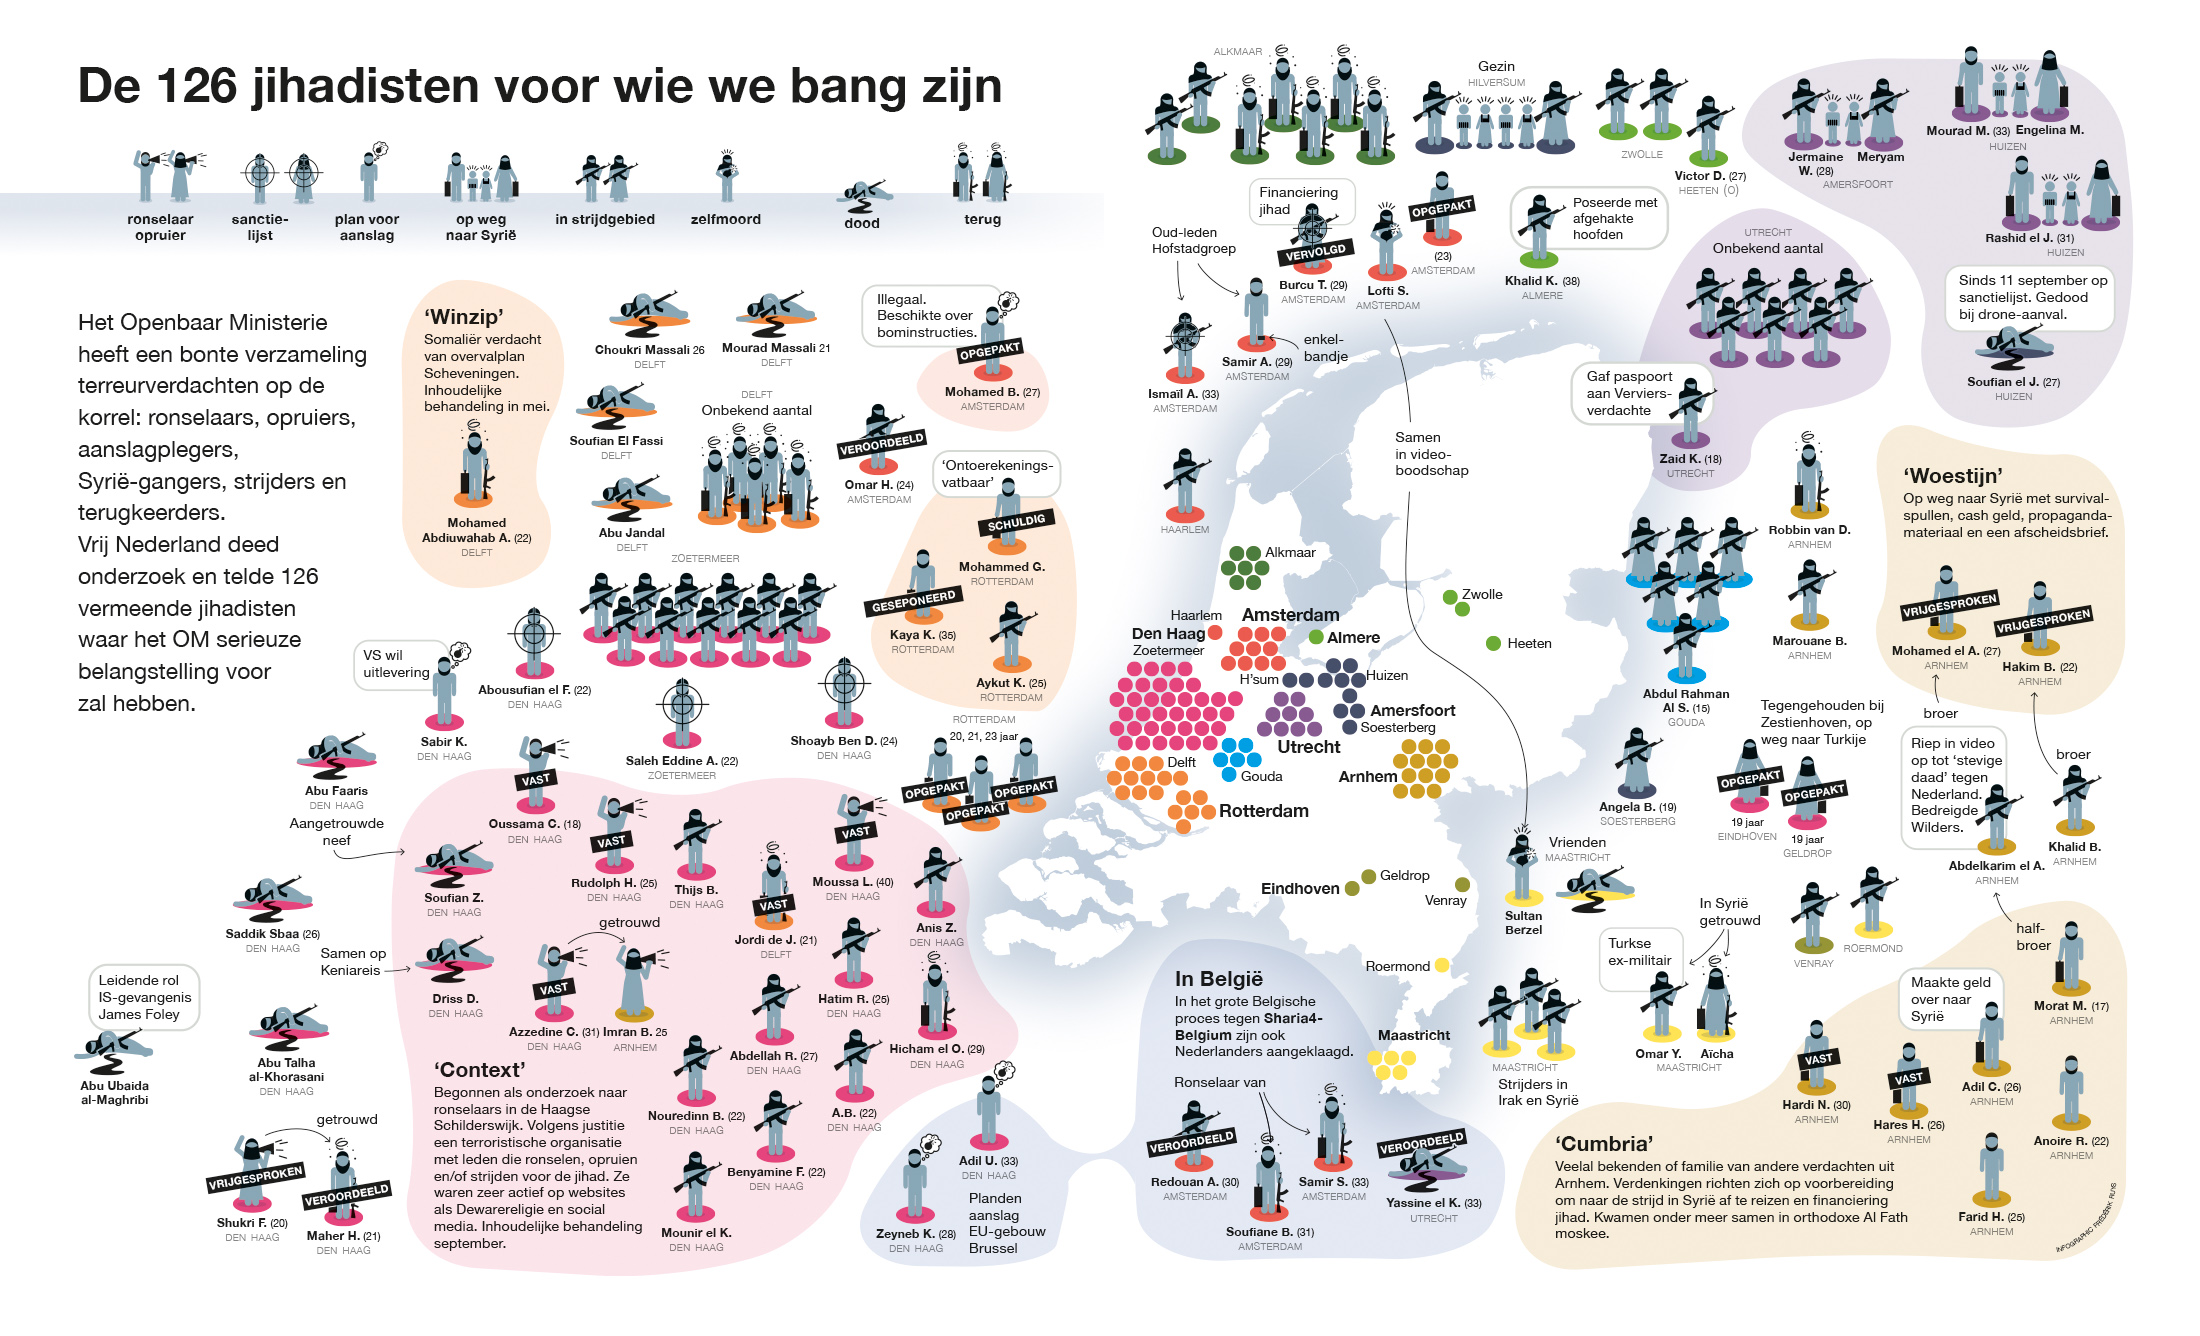
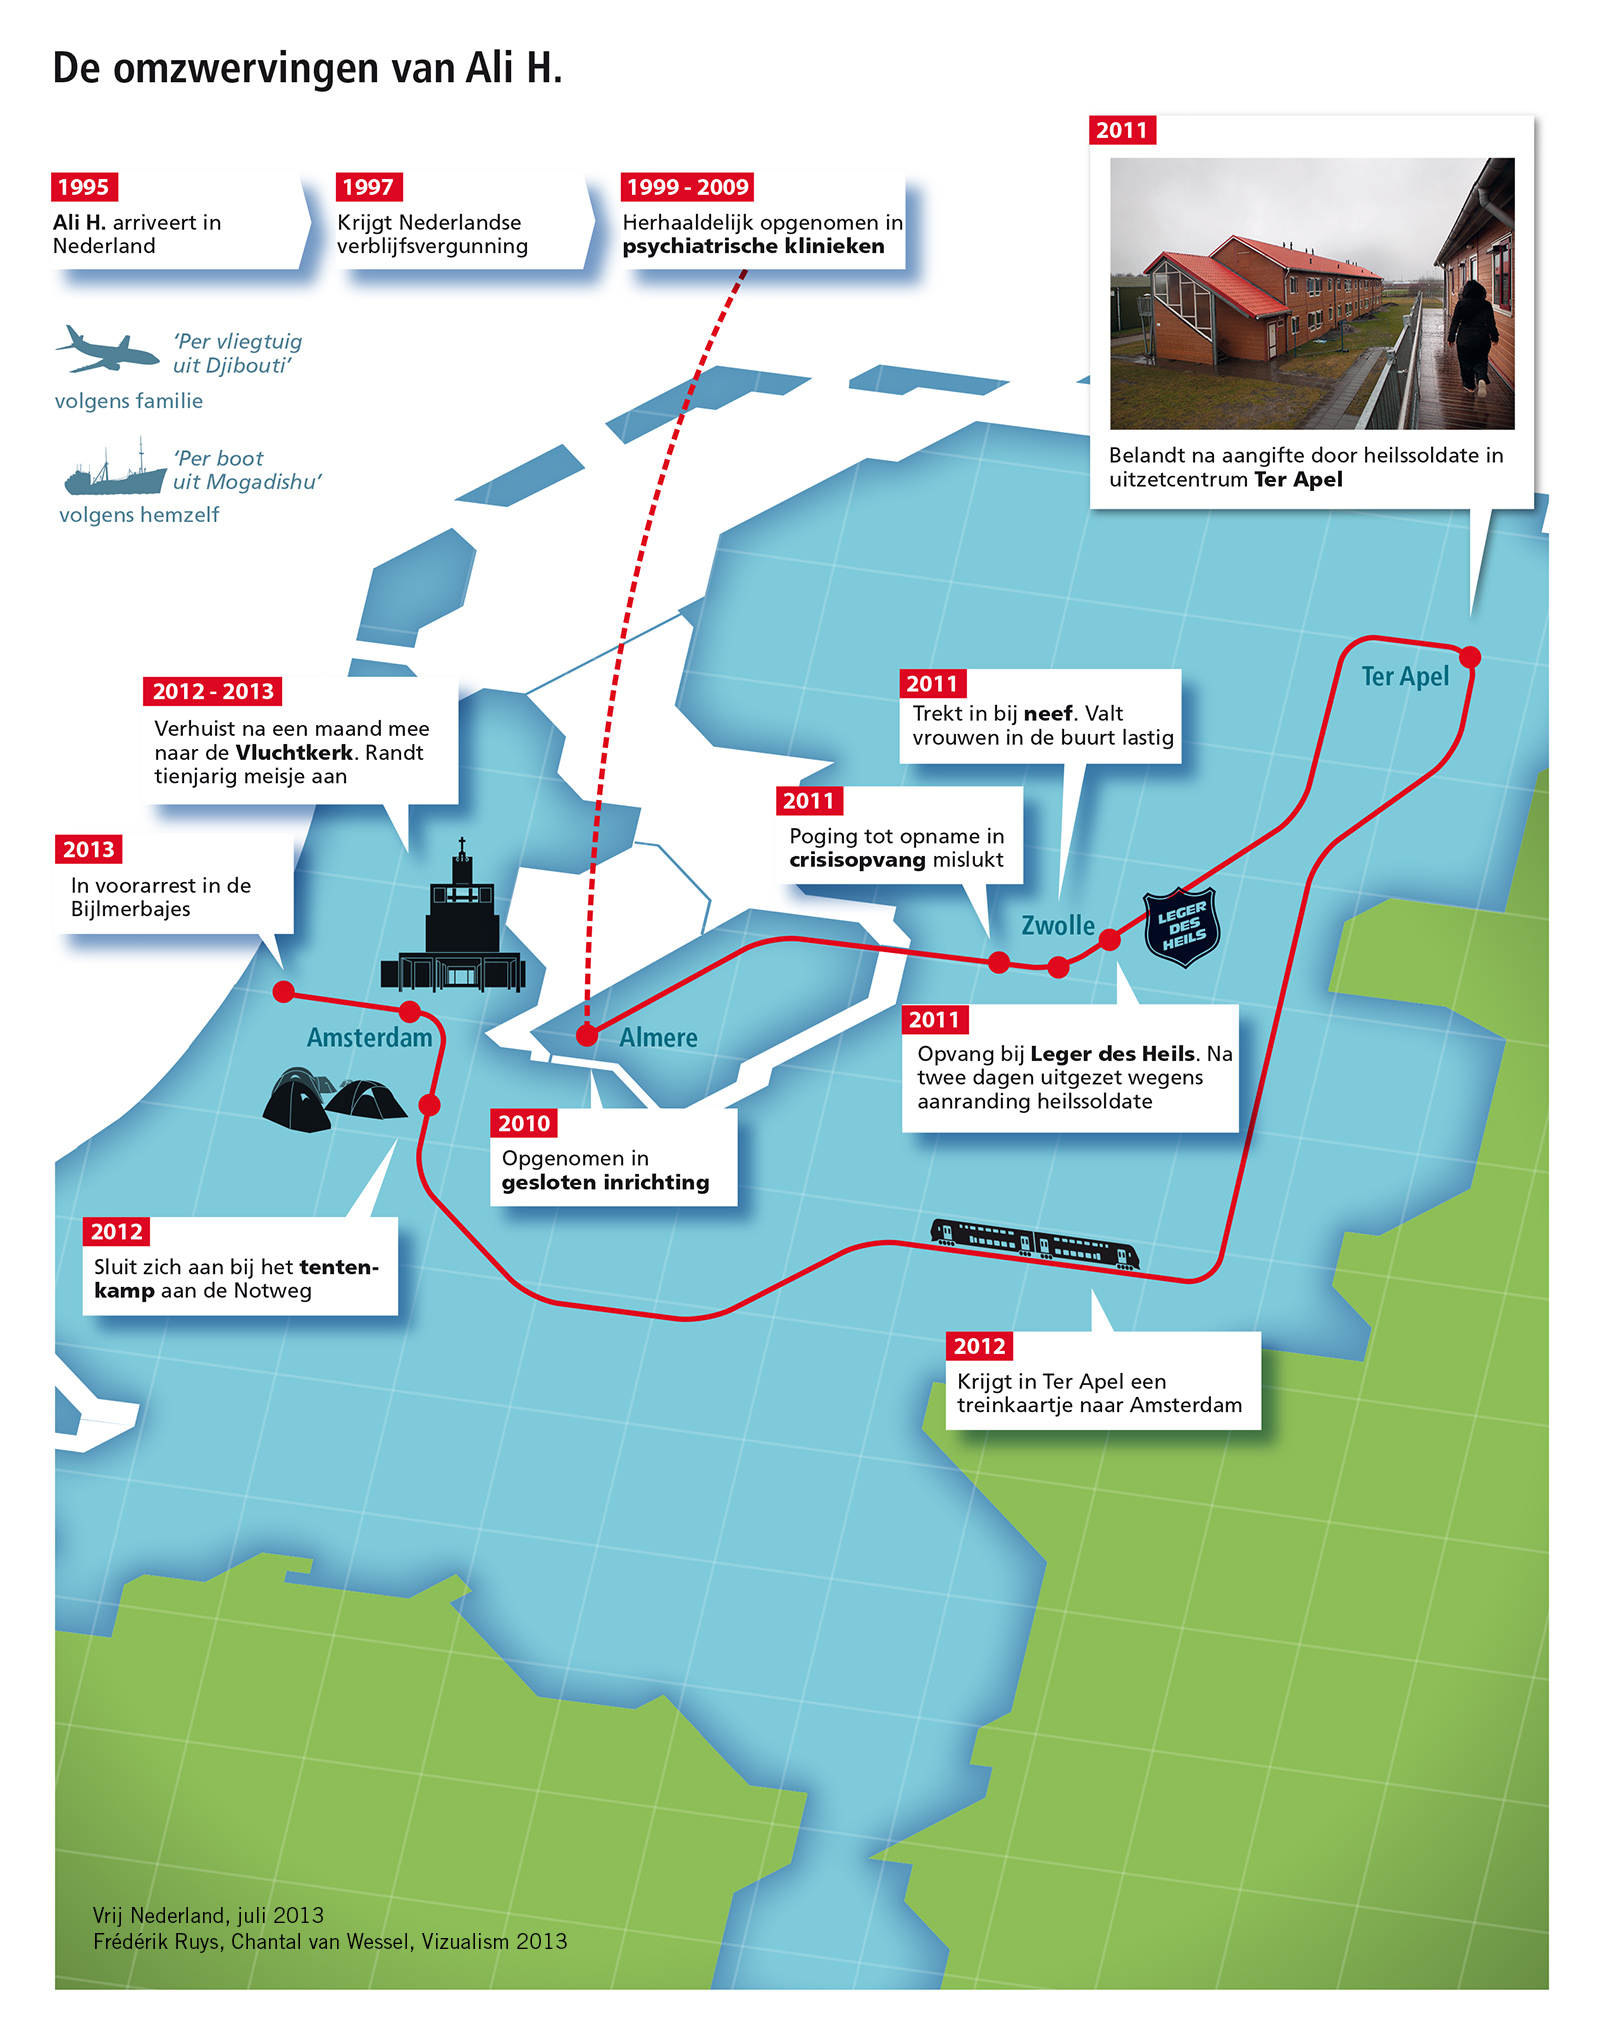
 Voor het tweewekelijkse tijdschrift Vrij Nederland maken we infographics over uiteenlopende onderwerpen. Een selectie:
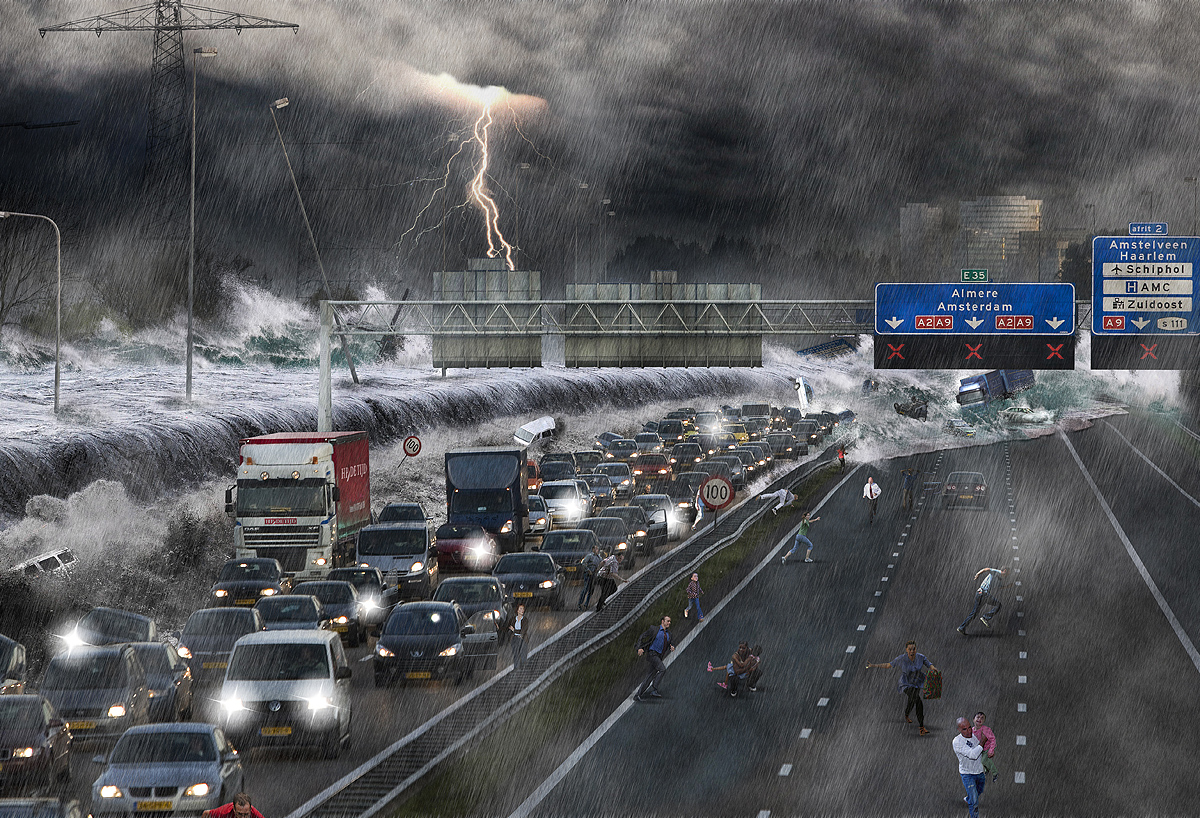

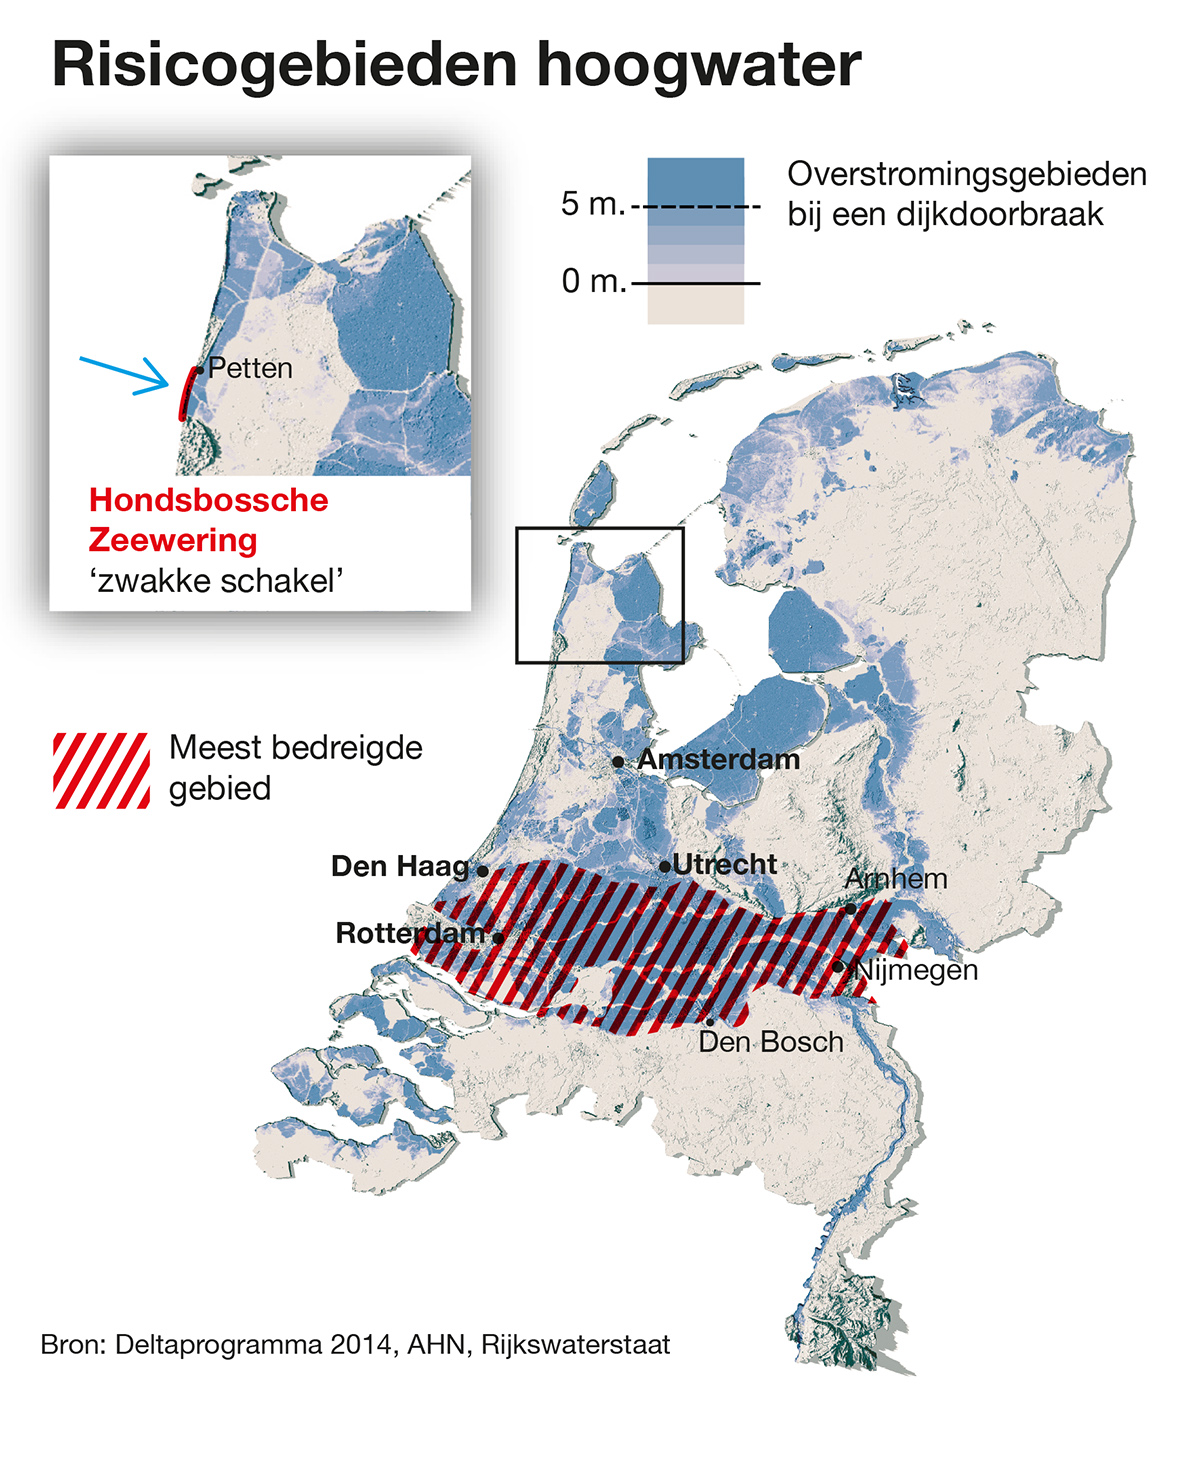
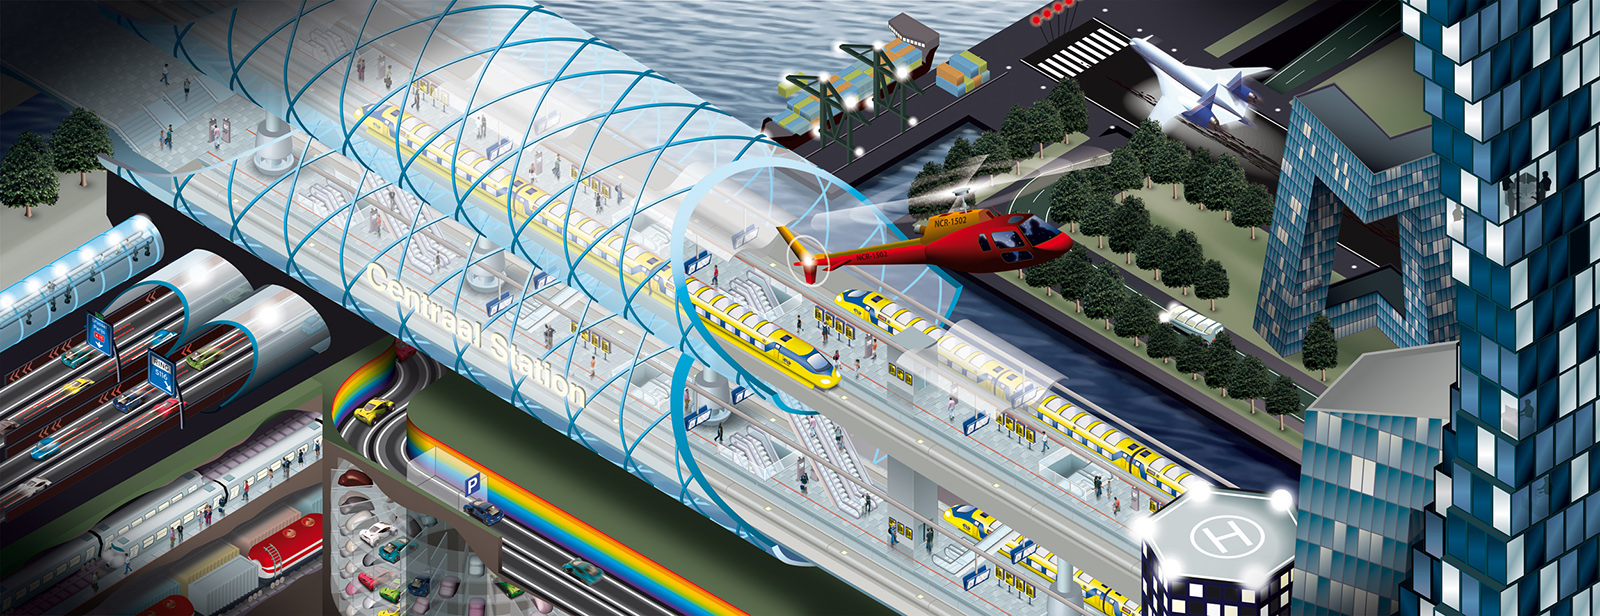
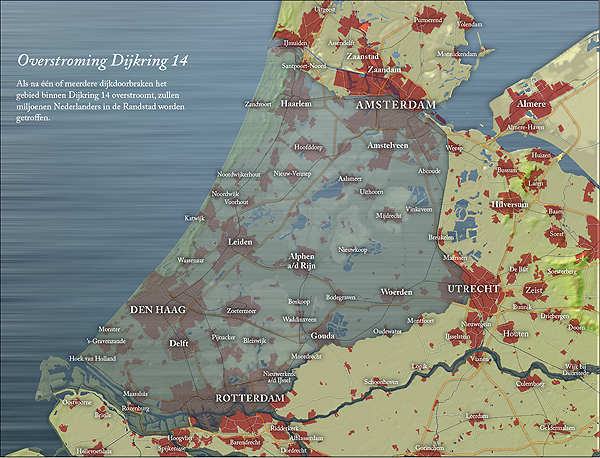
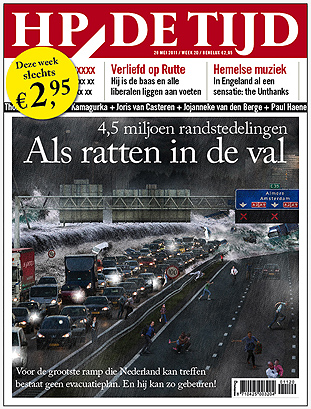 Prins Willem-Alexander waarschuwde de afgelopen jaren tot drie keer toe voor een mogelijke doorbraak van Dijkring 14. Als dit gebied onder water zou lopen, dan spreken kenners van een Ergst Denkbare Overstroming (EDO), omdat de steden Rotterdam, Den Haag, Amsterdam en (gedeeltelijk) Utrecht onder de zeespiegel zouden kunnen verdwijnen. Voor HP | De Tijd van deze week lieten wij onze fantasie de vrij loop en maakten we bovenstaande illustratie.
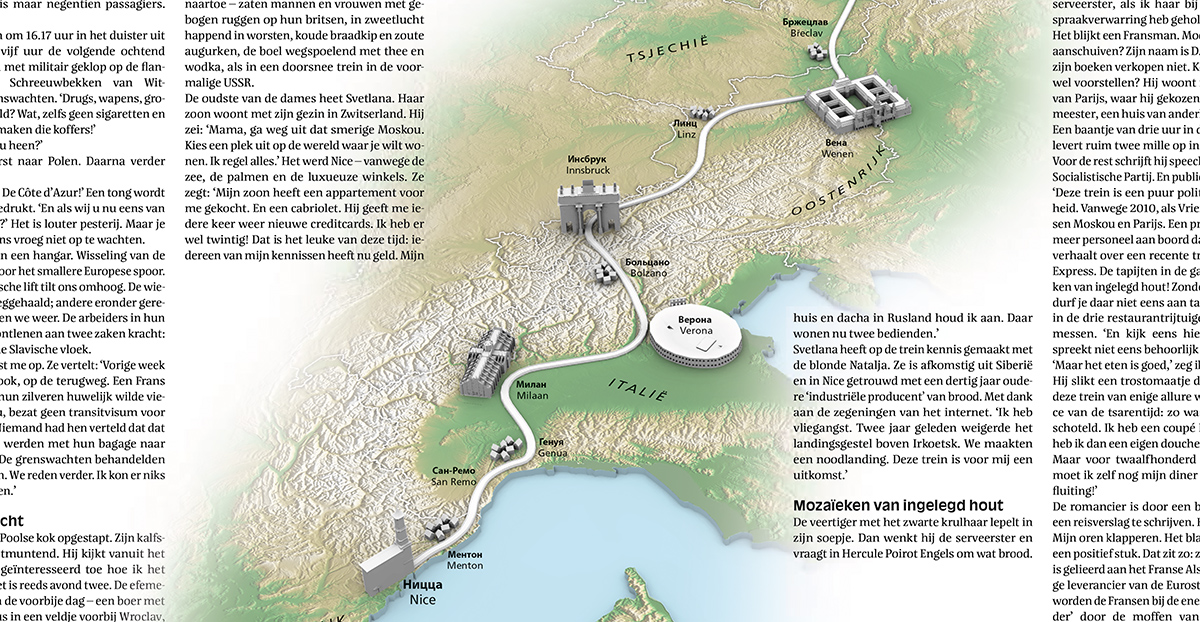 In 2010 werd de spoorlijn Moskou naar Nice nieuw leven ingeblazen: een reis van twee dagen door vijf landen. Vrij Nederland wijdde een reportage aan de 3318 kilometer lange route en Frédérik zette de belangrijkste tussenstops op de kaart.
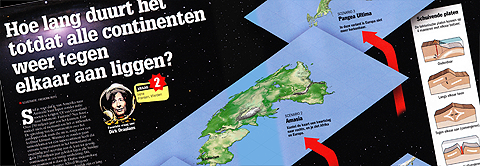
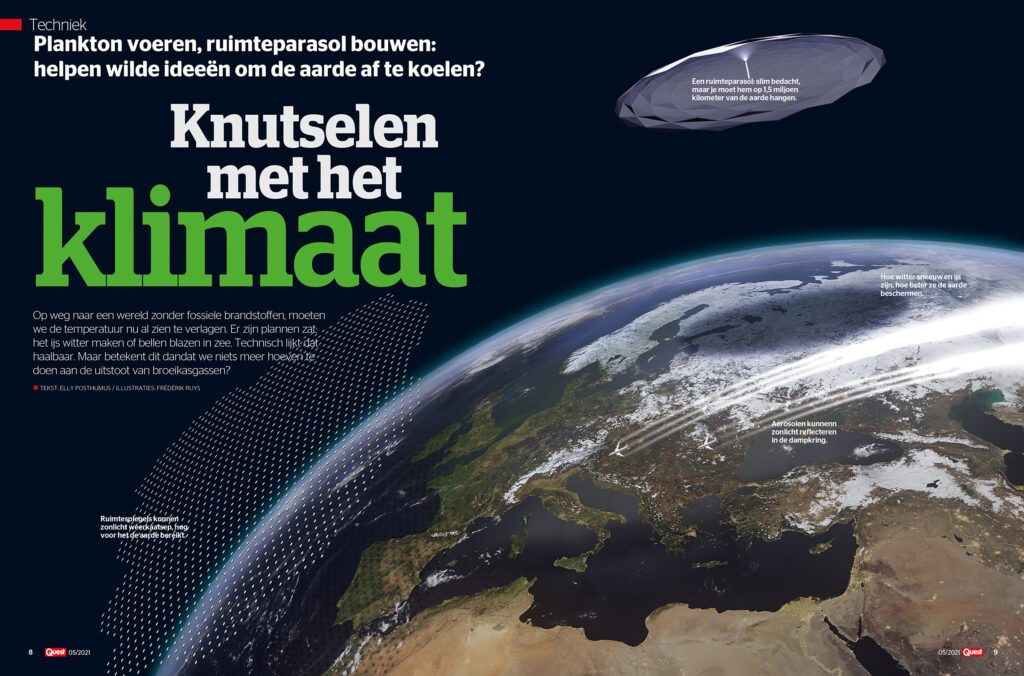
The earth’s continental plates are continuously moving. Since the earth’s rocky outer crust solidified billions of years ago, it broke up into huge, thick plates that drift atop the soft, underlying mantle. We know approximately how Pangea must have looked like. But how will earth’s map evolve 225 million years from now? Watch our maps of the future in this month’s edition of Quest 101.


