Animatie TenneT

De AOW-leeftijd naar 67 jaar
.embed-container { position: relative; padding-bottom: 56.25%; height: 0; overflow: hidden; max-width: 100%; } .embed-container iframe, .embed-container object, .embed-container embed { position: absolute; top: 0; left: 0; width: 100%; height: 100%; }
Geanimeerde infographic in opdracht van de Rijksvoorlichtingsdienst en het Ministerie van Sociale Zaken over het wetsvoorstel van het kabinet Balkenende IV inzake de verlaging van de AOW-leeftijd.
Publicatie: Februari 2010
Animatie: Frédérik Ruys
Stem: Beatrijs Sluyter
De gevolgen van de crisis voelen we nog jaren
.embed-container { position: relative; padding-bottom: 56.25%; height: 0; overflow: hidden; max-width: 100%; } .embed-container iframe, .embed-container object, .embed-container embed { position: absolute; top: 0; left: 0; width: 100%; height: 100%; }
Geanimeerde infographic over de Rijksbegroting 2010 gepresenteerd op Prinsjesdag, door Frédérik Ruys, www.vizualism.com, in opdracht van de Rijksvoorlichtingsdienst en het Ministerie van Financiën.
Gevolgen van de crisis voor de Rijksbegroting
.embed-container { position: relative; padding-bottom: 56.25%; height: 0; overflow: hidden; max-width: 100%; } .embed-container iframe, .embed-container object, .embed-container embed { position: absolute; top: 0; left: 0; width: 100%; height: 100%; }
Geanimeerde infographic over de Gevolgen van de crisis als toelichting bij de Rijksbegroting 2010, gepresenteerd op Prinsjesdag, in opdracht van de Rijksvoorlichtingsdienst en het Ministerie van Financiën.
Politiekverslaggever Ron Freesen legt het nog een keertje uit met behulp van de infographic .
Horizonchart about the crisis of credits 2007 – 2008
.embed-container { position: relative; padding-bottom: 56.25%; height: 0; overflow: hidden; max-width: 100%; } .embed-container iframe, .embed-container object, .embed-container embed { position: absolute; top: 0; left: 0; width: 100%; height: 100%; }
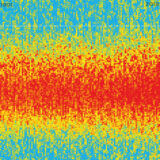
The horizon chart appeared to be the most effective way to visualize the dropping of stocks on the Amsterdam Exchange from January 2007 to December 2008. All funds – without exception – turned red. Especially the informative labels on the charts, highlighting crucial moments in the financial crisis, changed the datavisualisation into an information graphic. Designed by Frédérik Ruys, published in Het Financieele Dagblad on december 20th, 2008.
As the visualisation method needed some explanation to a broader audience than just the readers of the Dutch newspaper, I made the explanation above.


