
























Data-animatie over de Westerschelde
De Zeeuwse Delta is continu in beweging. Van de grote hoeveelheid schepen in de Westerschelde tot de constante ontwikkeling van de natuur: de Delta ziet er elke dag anders uit. We monitoren er daarom doorlopend, maar welke informatie halen we nou eigenlijk op om de Delta veilig en toekomstbestendig te houden? Data-animatie voor Deltares / Rijkswaterstaat / NCK.
Data
1. Storm dataDescription: DCSM-FM_100m_structuredAt250m_NorthSea_h6.nc Water level North Sea, Sinterklaasstorm 2013 |
2. Coastline
Description: GeoTIFFs Paleontologische kaart (9000 v. Chr.) |
3. Oosterscheldekering
Description: Pointcloud |
4. Roggeplaat  Description: Timelapse 2010, 2012, 2014, etc. Source: Luchtfoto’s Kadaster Provided by: Frederik Frames: 1300 – 1800 |
5. Kustprofielen
Description: Kustverdediging 2010 – 2020 |
6. ZandsupletieDescription: Suppleren (beach nourishment) |
7. BaggerenDescription: Baggeren (dredging) |
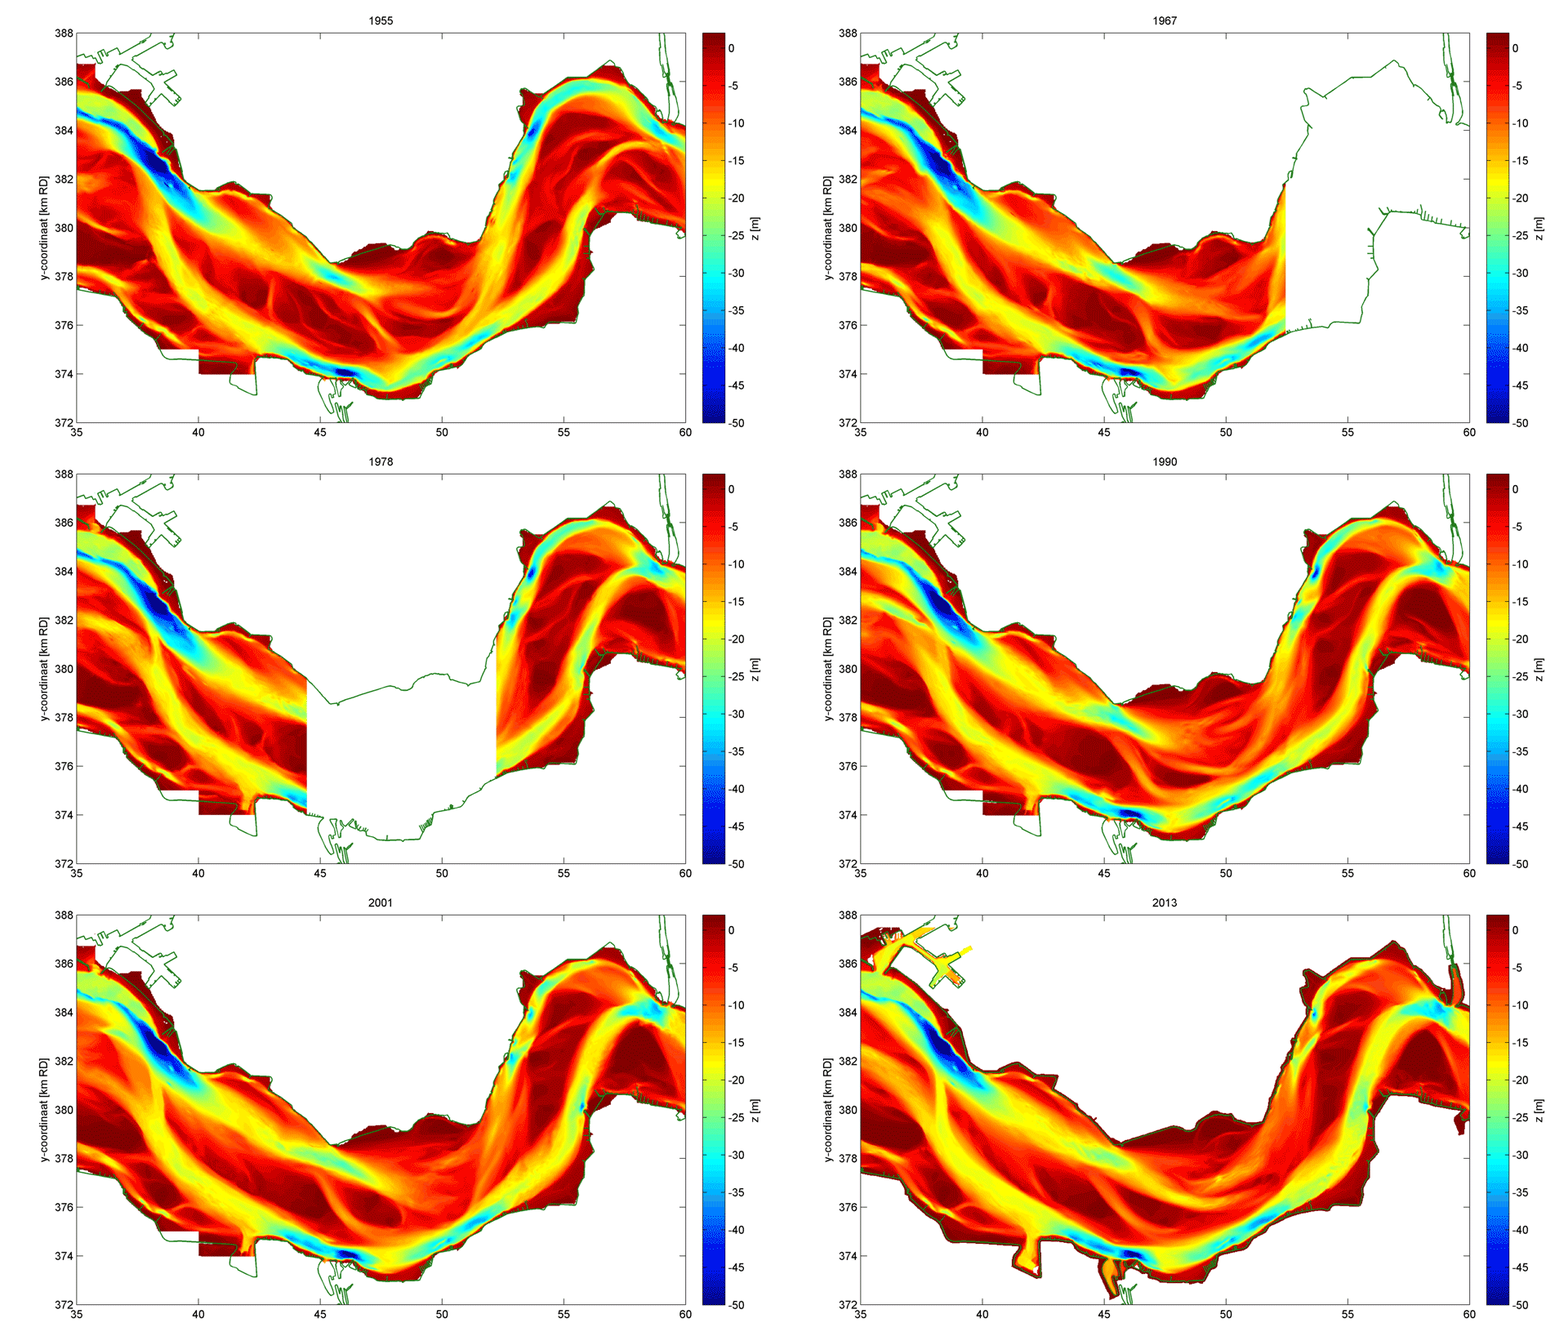
8. Bathymetry
Description: bathymetrie 1955 – 2020 |
9. Scheepvaartverkeer
Description: Scheepvaart |
10. Saeftinghe  Description: Timelapse Saeftinghe 2003 – 2020 (+ Hedwigepolder?) |
11. VloedlijnDescription: Tideline DCSM-FM_100m_0004_map[1-1154] |
12. Meetstations
Description: lat lon meetpunten- |
13. Survey planes
Description: tracks |
14. Satellites
Description: generated tracks |