





































Gemiddelde zomertemperatuur 1901 – 2026
L’été 2026 est le plus chaud jamais enregistré en France. Entre le 1er juin et le 31 août, la moyenne des températures maximales diurnes et minimales nocturnes a atteint 24 °C dans l’Hexagone et en Corse.
Pour chaque station, la visualisation utilise la variable quotidienne TM fournie par Météo-France (la moyenne arithmétique des températures horaires disponibles au cours de la journée).
On distingue également le précédent record, établi en 2003, ainsi que l’extension du réseau de stations météorologiques automatiques Météo-France à partir des années 1950 (alimentées par des piles, celles-ci transmettaient leurs données sept fois par jour par ondes courtes).
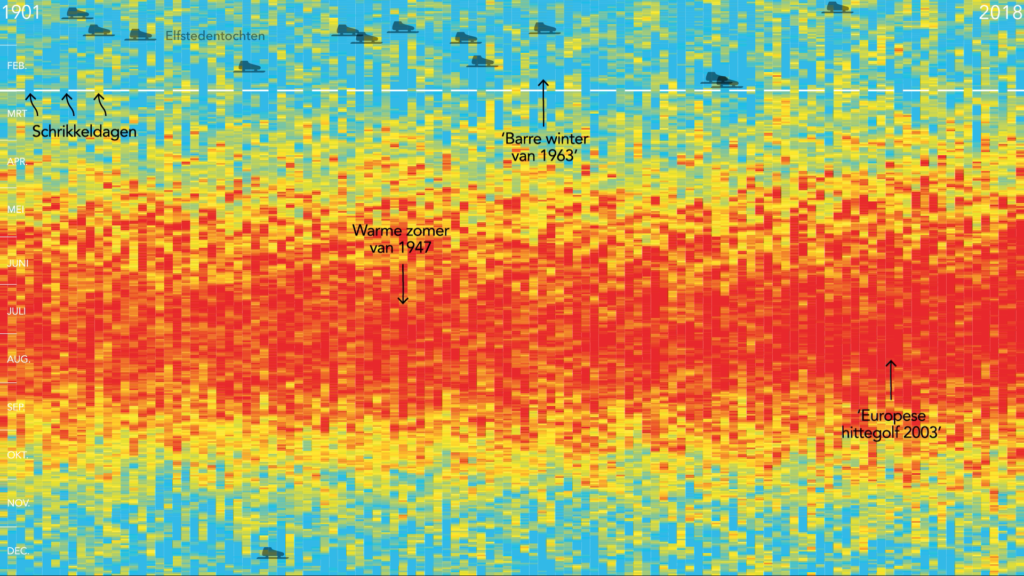
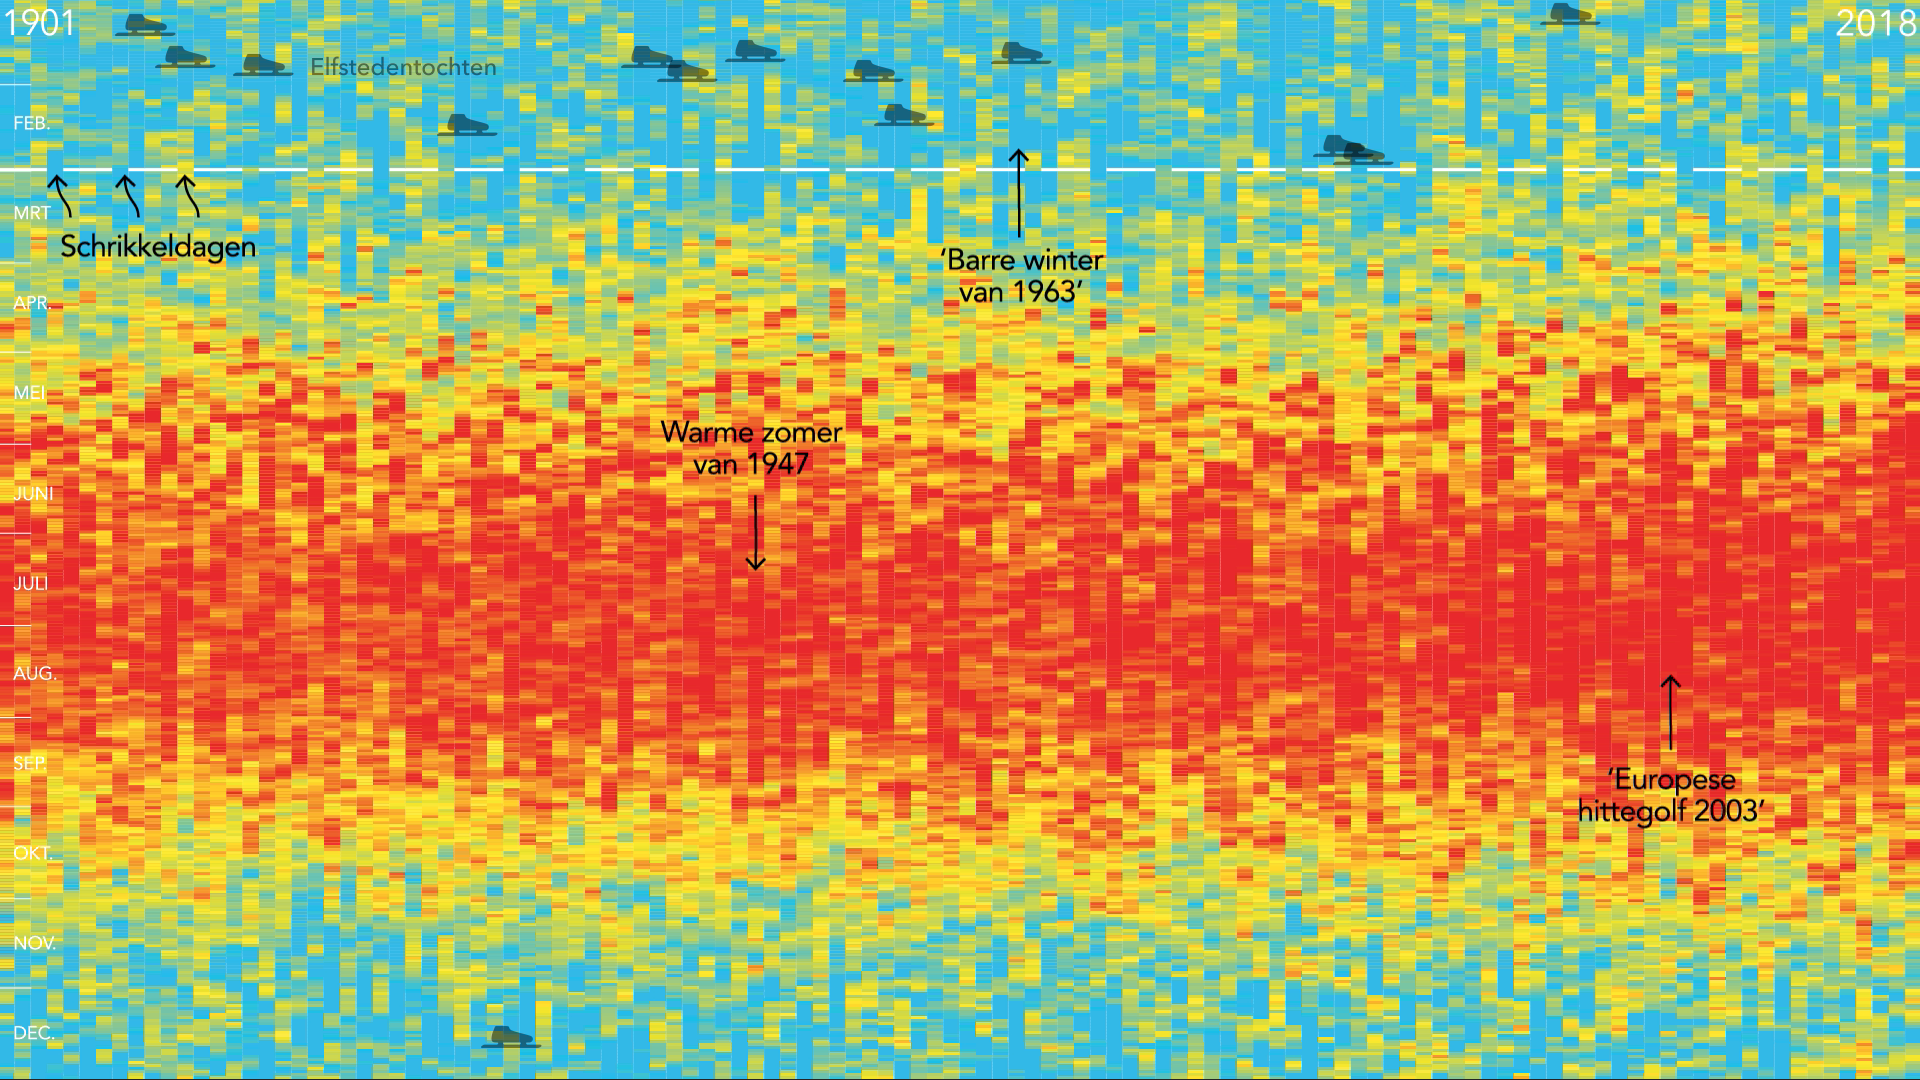
De laatste jaren waren de zomers onmiskenbaar warmer. Maar die van 2026 breekt alle records. Gemiddelde zomertemperatuur per automatisch weerstation van het KNMI – Koninklijk Nederlands Meteorologisch Instituut van 1901 t/m 2026.
Process
-
Data source:
Météo-France daily climatological observations, downloaded as compressed departmental CSV files from the Météo-France dataset on data.gouv.fr. The resource catalogue is accessed through the data.gouv.fr API. Météo-France also provides a station-based Climatological Data API and English API documentation.
-
Temperature indicator:
The visualization uses the daily variable TM, defined as the arithmetic mean of the available hourly temperature measurements for that day—not as
(Tmax + Tmin) / 2. -
Summer calculation:
For each station and year, the arithmetic mean of all valid daily TM values between 1 June and 31 August is calculated. Values carrying quality code QTM = 2 doubtful or awaiting verification—are excluded. A station is retained only when at least 80 valid summer days are available.
-
Geographical data:
The national boundary is read from the supplied
eucountries.shpfile by selectingCNTRYNAME = "France". Metropolitan France and Corsica are shown in an orthographic projection centred on the geometry’s centroid. -
Spatial interpolation:
Station values are interpolated onto a 900 × 900 grid using inverse-distance weighting (IDW), based on the 10 nearest stations and a distance power of 2. The resulting field is clipped strictly to the French boundary.
-
Stripe calculation:
For every horizontal pixel row—approximately representing a latitude—the script calculates the mean of all interpolated temperatures available inside the French boundary. Each year is converted into a vertical stripe 7 pixels wide.
-
Colour scale:
The jet colour map covers 0–30 °C, with labels every 5 °C. The maximum jet colour is reached at 27 °C and remains unchanged between 27 and 30 °C.
-
Animation processing:
During a 10-frame transition, every horizontal row of the temperature map contracts from the width of France to the width of one stripe while moving left. The complete map, including its boundary and fixed annotations, remains visible during this transformation.
-
Main Python libraries:
pandas and
NumPy for data processing;
GeoPandas,
Shapely and
pyproj for geographical operations and projection;
SciPy cKDTree for nearest-neighbour searches;
Matplotlib contourf for the temperature maps; and
Pillow for compositing, resizing and exporting the PNG animation frames.