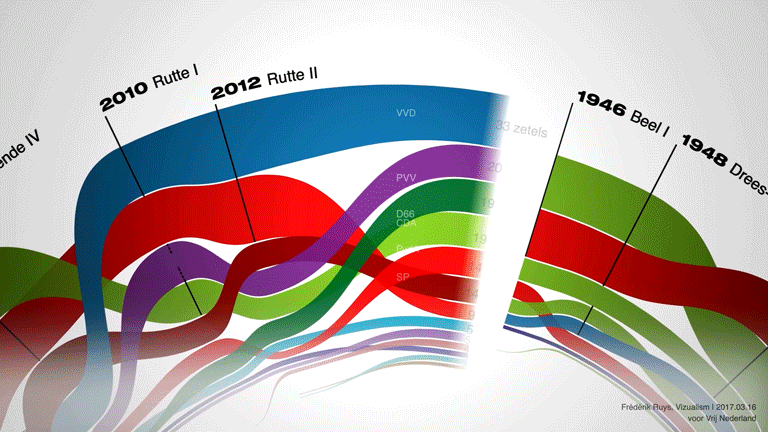
Demografische ontwikkeling van de Nederlandse bevolking in de drie krimpregio’s (links) en de vier grote steden (rechts).

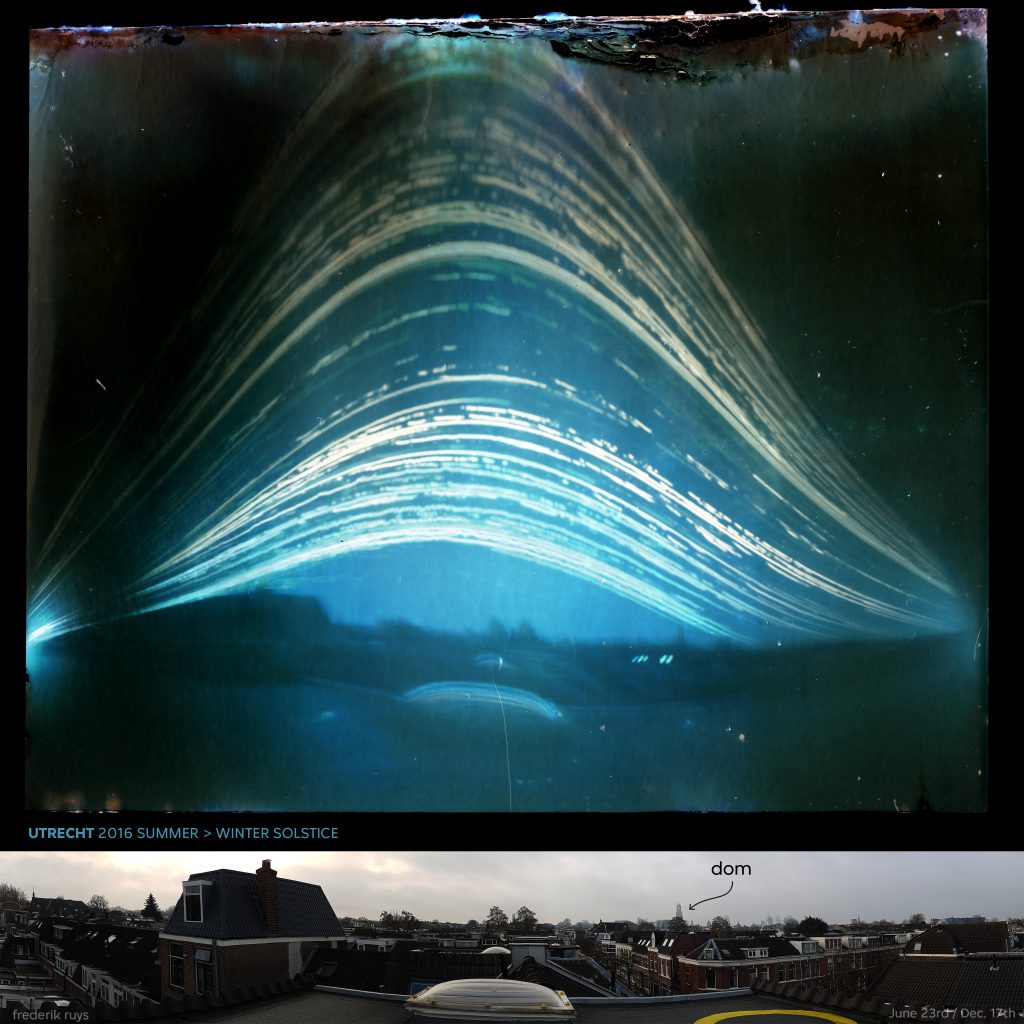
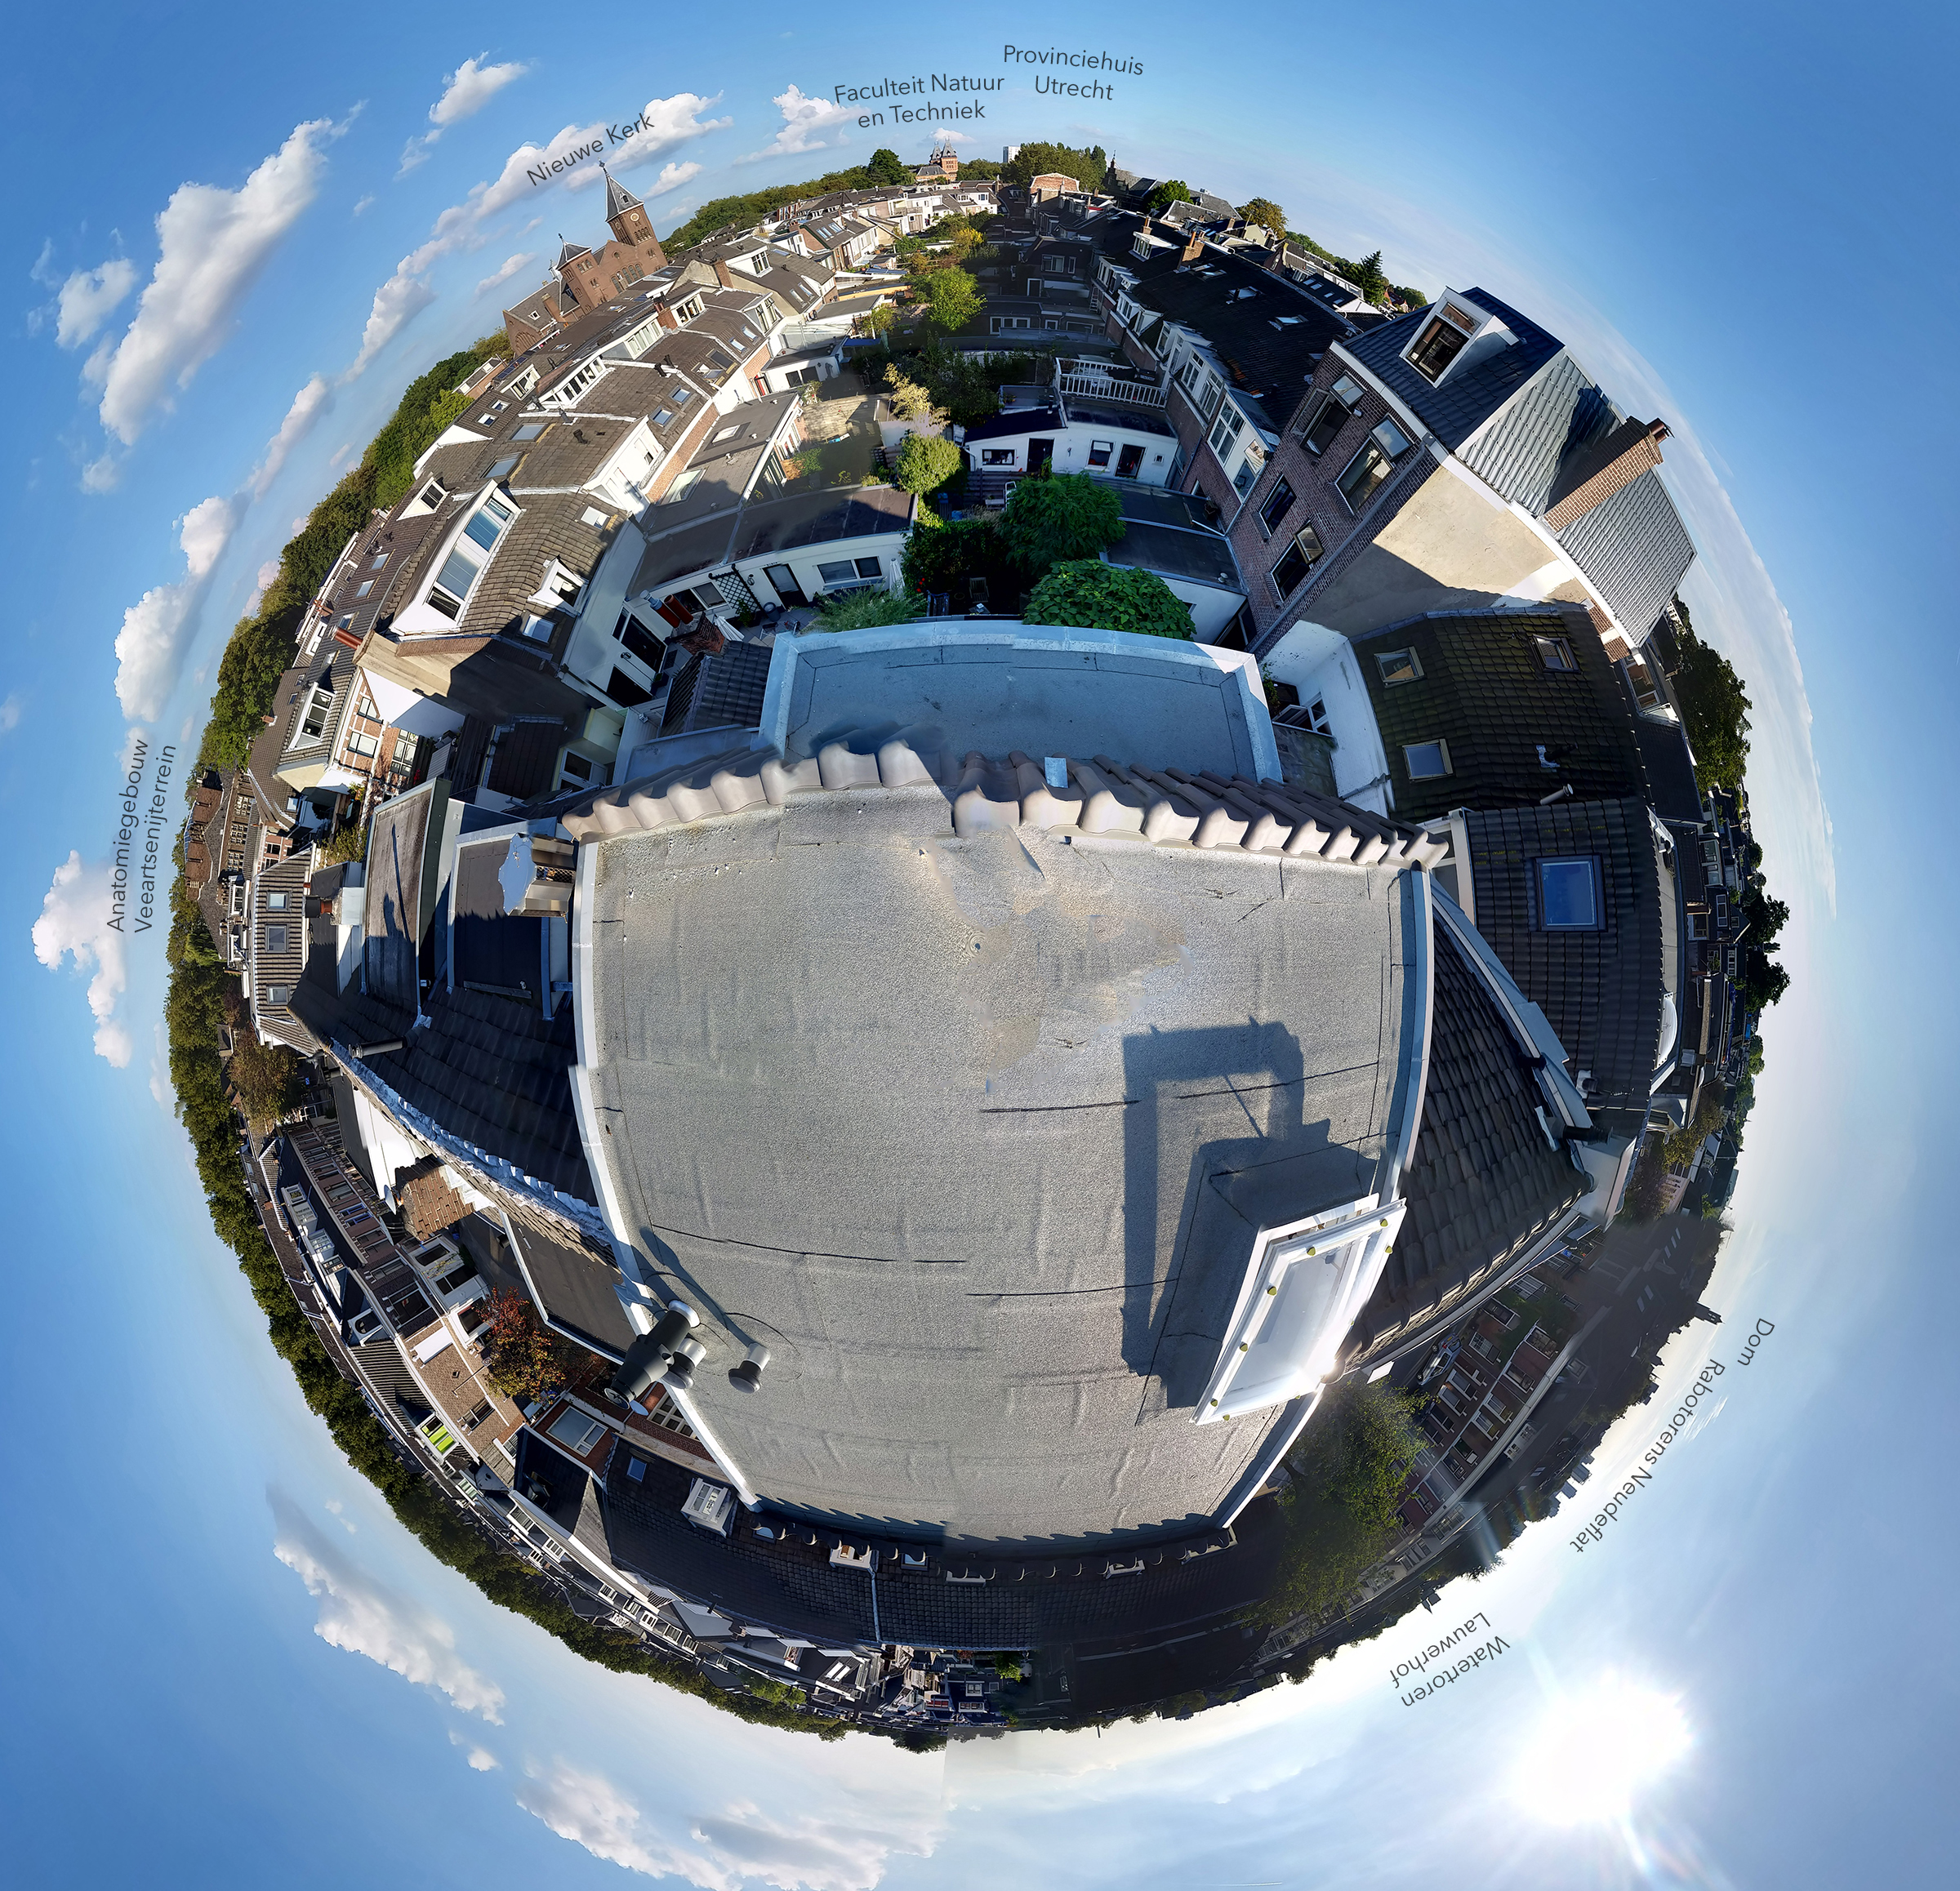
Moon sets behind Dom tower
More info

.embed-container { position: relative; padding-bottom: 56.25%; height: 0; overflow: hidden; max-width: 100%; } .embed-container iframe, .embed-container object, .embed-container embed { position: absolute; top: 0; left: 0; width: 100%; height: 100%; }
Author Reif Larsen at the Dutch Infographic Conference #IC13nl about infographics and his spike of excitement while working on his novel ‘The Selective Works of T.S. Spivet’. Reif and his ‘Chart of infogasm’ was most probably the big infographic surprise of 2013. And we can’t wait for the release of his movie, directed by Jean Jeunet, in theaters this fall.
Is het verzamelen, meten en visualiseren van persoonlijke data een nieuwe speeltuin voor ontwerpen? In een nieuwe editie van CrossLab Events presenteerden Mike Thompson en Susana Cámara Leret ‘Aqua Vita’, een visueel dagboek over hun lichaam gebaseerd op hun dagelijkse urine. Bureau Clever Francke, gespecialiseerd in datavisualisatie, legde uit hoe je data op visuele wijze vertaalt naar een verhaal. Tenslotte ging James Burke, interaction en user experience designer, in op de drijfveren achter Selftracking en the Quantified Self. Datajournalist en –vormgever Frédérik Ruys modereerde deze avond, die georganiseerd werd door de Willem de Kooning Academy.
European central bank @ecb presents the new 5 euro banknote and fails again. Design unsurprisingly outdated. pic.twitter.com/6d3pveDR
— frédérik ruys (@fruys) January 10, 2013
Dolgelukkig met uitgave #atlasdewit doch licht teleurgesteld in repro Utrecht. Wil @Lannoo mijn origineel tbv herdruk? pic.twitter.com/Kwmm6aq2
— frédérik ruys (@fruys) December 9, 2012
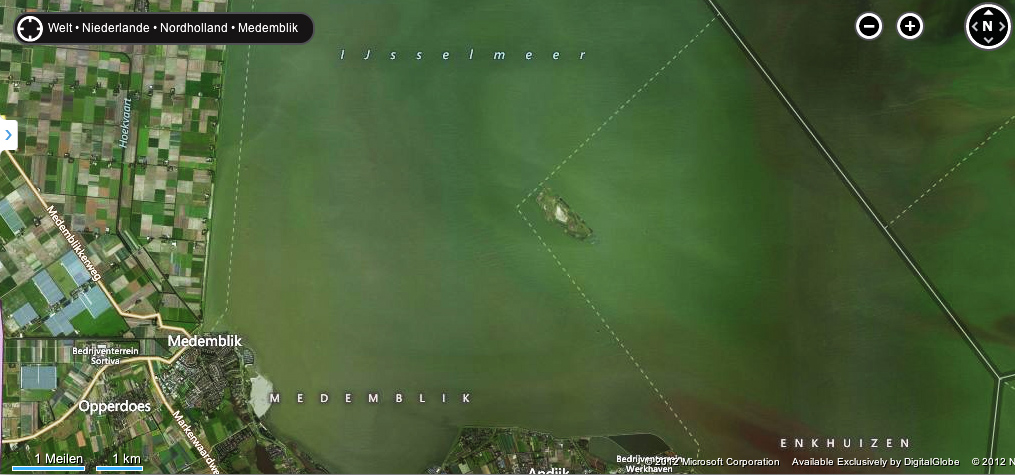
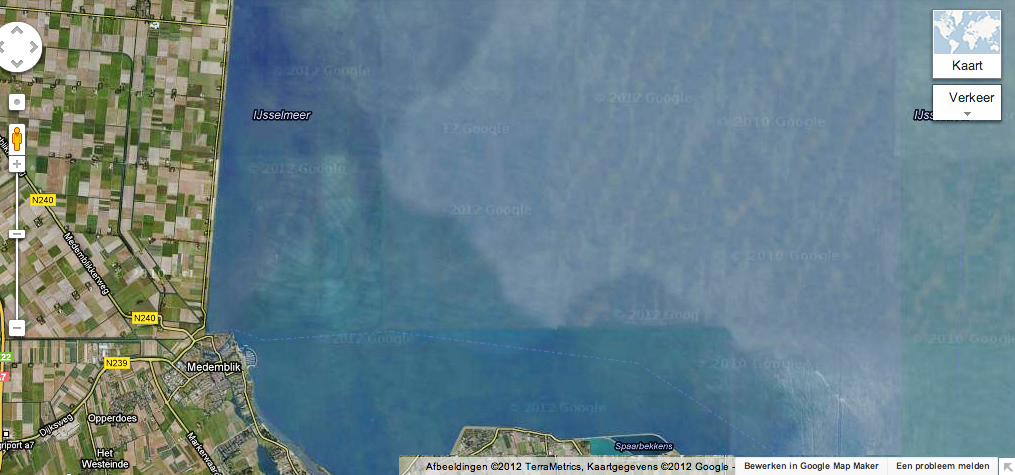
Al slepend door Google Maps stuitte ik vorig jaar bij toeval op een eilandje in het IJsselmeer. Het leidde tot onderstaand item in ‘Nederland van Boven’. Wellicht dat Staatsbosbeheer sindsdien nieuwsgierigen naar dit vogelparadijs op afstand probeert te houden, want in de week dat elders op de wereld het fantoomeiland Sandy in de Koraal Zee wereldnieuws werd, bleek Google Maps ons zandeiland (1500 x 500 meter) inmiddels vakkkundig heeft weggepoetst.
Gelukkig laat Microsofts Bing het eiland nog wel zien.
 |
 |
|
zie Microsofts Bing Maps |
zie Google Maps |
 De Beroepsorganisatie Nederlandse Ontwerpers (BNO) en de Nederlandse Vereniging voor Journalisten (NVJ) hebben de genomineerden bekend gemaakt voor de jaarlijkse Infographic Jaarprijs:
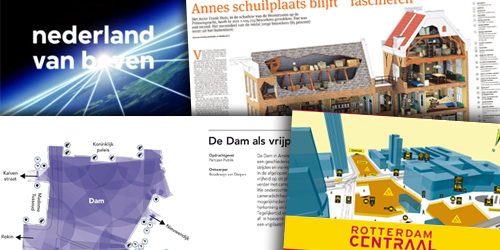
Dubbelfeest voor Vizualism dus, aangezien wij zowel bij de historische reconstructie van het Achterhuis (gepubliceerd in het Parool) als bij Nederland van Boven betrokken zijn geweest. Alle genomineerden staan hier.
Jury-voorzitter Carel Kuitenbrouwer schreef een interessante analyse over de genomineerden.
Wat het nieuwe #oorlogsmonument in #Geffen pas echt omstreden maakt, is het gebruik van #ComicSans voor het opschrift http://t.co/qT7ivzbn
— frédérik ruys (@fruys) October 20, 2012
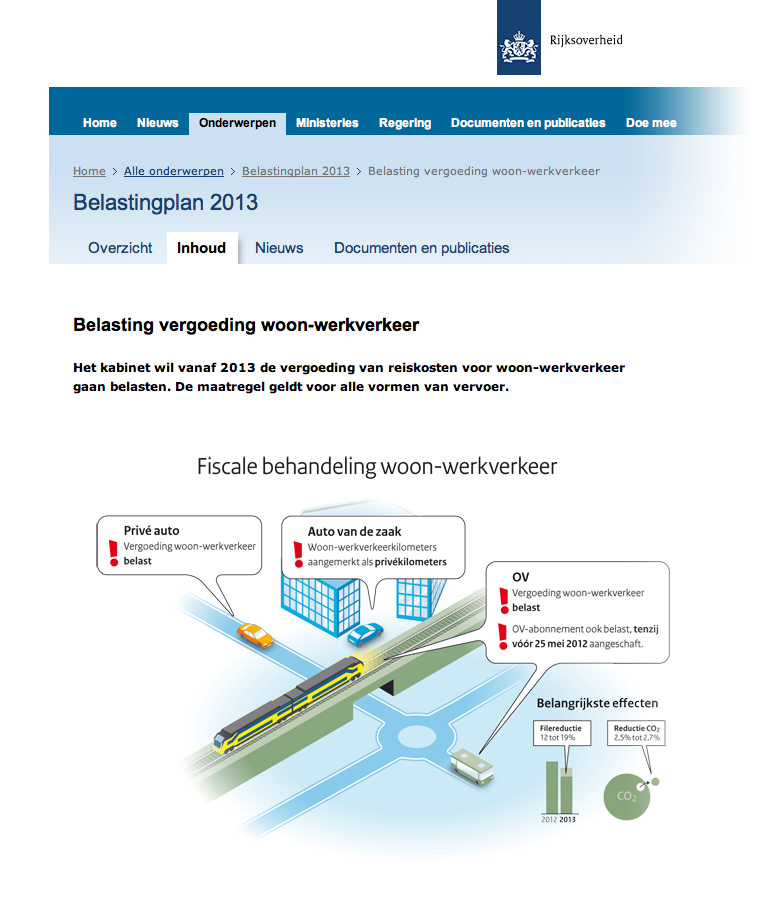
Staatssecretaris Frans Weekers (Financiën) gaf op Prinsjesdag een persconferentie over het nieuwe belastingplan voor 2013. Voor zijn presentatie – en voor de website – ontwikkelden we een aantal infographics over de hypotheekrente aftrek, de verhuurderheffing en de belasting op de vergoeding woon-werkverkeer.
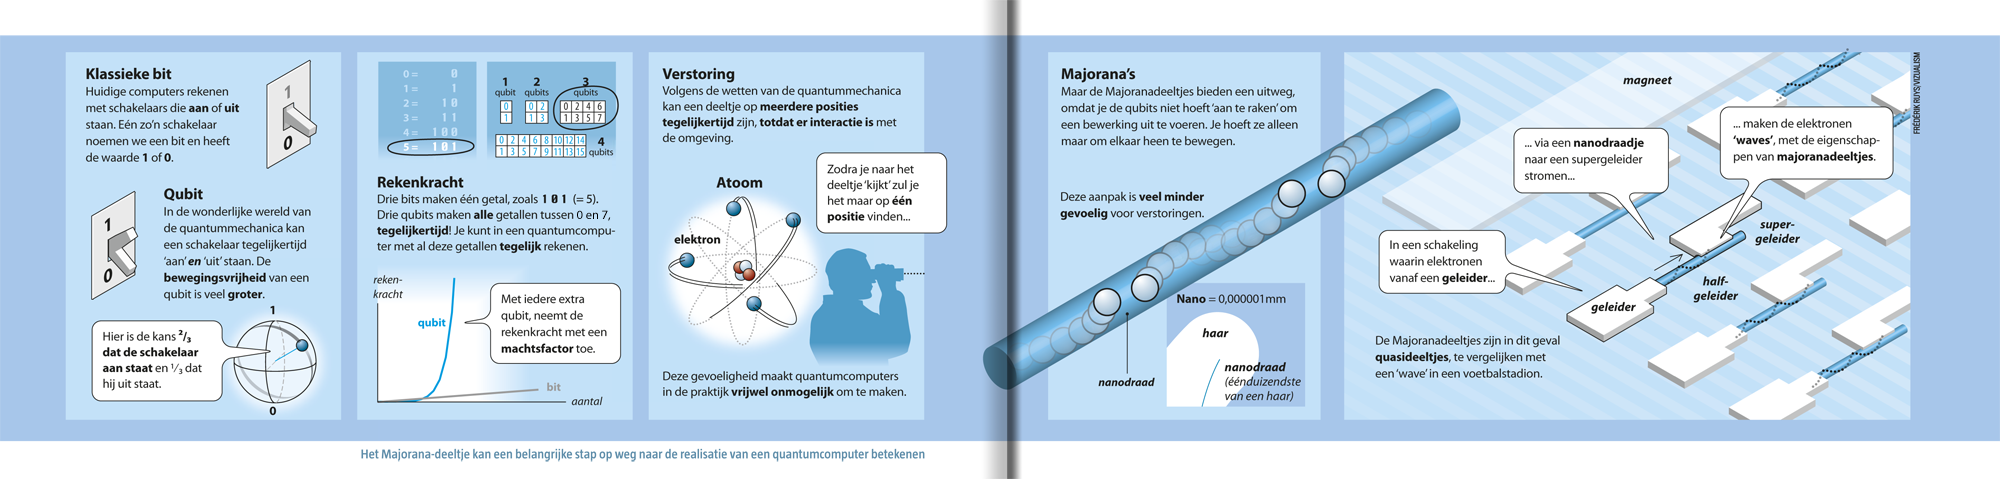
Sinds 1937 zochten natuurkundigen naar het geheimzinnige Majorana-deeltje. Tot begin dit jaar, toen de Nederlandse natuurkundige Leo Kouwenhoven het deeltje vond. Met zijn ontdekking is de komst van de kwantumcomputer dichterbij gekomen. Maar hoe leg je dat in zes stappen uit? Samen met auteur Gerard Janssen, die Leo Kouwenhoven voor Vrij Nederland interviewde, deed ik een poging. De uitgave van Vrij Nederland ligt vanaf 25 augustus in de winkel.
Dutch broadcaster VPRO used extensive data resources to put together a tv series, named The Netherlands from above. This documentary ran ten episodes and was weekly rated over 1.2 million viewers nationally, ranking as one of the most watched shows in the country.
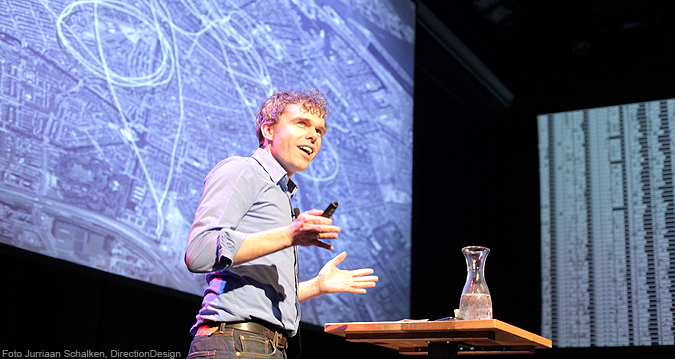
 In his presentation Bringing geography to national TV at the ESRI user conference in San Diego, data-journalist and information designer Frédérik Ruys, reveals the challenges and pitfalls of visual storytelling and datavisualisations while sharing his ambitions for the second season.