• Pinterest
  • Facebook
  • Twitter
  • Youtube
  • Linkedin
  • Login
  • Registration
  • Blog
    • Projects
      • Quest
      • Column VN
      • I ❤ Utrecht
      • Onzichtbaar NL
      • NL van Boven
        • dvd
        • TV Season 1
        • TV Season 2
        • Atlas
    • Honors & awards
    • Funny
  • Infographics
    • Media types
      • Visualization
      • Animation
      • Interaction
      • Datasculption
    • Taxonomy
      • Who
      • Where
      • When
      • What
      • How
      • How much
    • Clients
      • Non-profit
      • Educational
      • Governmental
      • Editorial
      • Corporate
  • Publications
    • Bibliography
    • Interviews
    • Videos
  • Downloads
    • slides
    • client area
  • Workshops
    • Dataviz Festival
    • Agenda
    • Tutorials
    • Crash Course
    • Databorrels
  • Contacts
    • Biography
    • Address
    • Faq

Collegetour KPN

Donderdag 29 november 2018

password: erasmusbrug

04_taxonomie

Handige DIY-tools

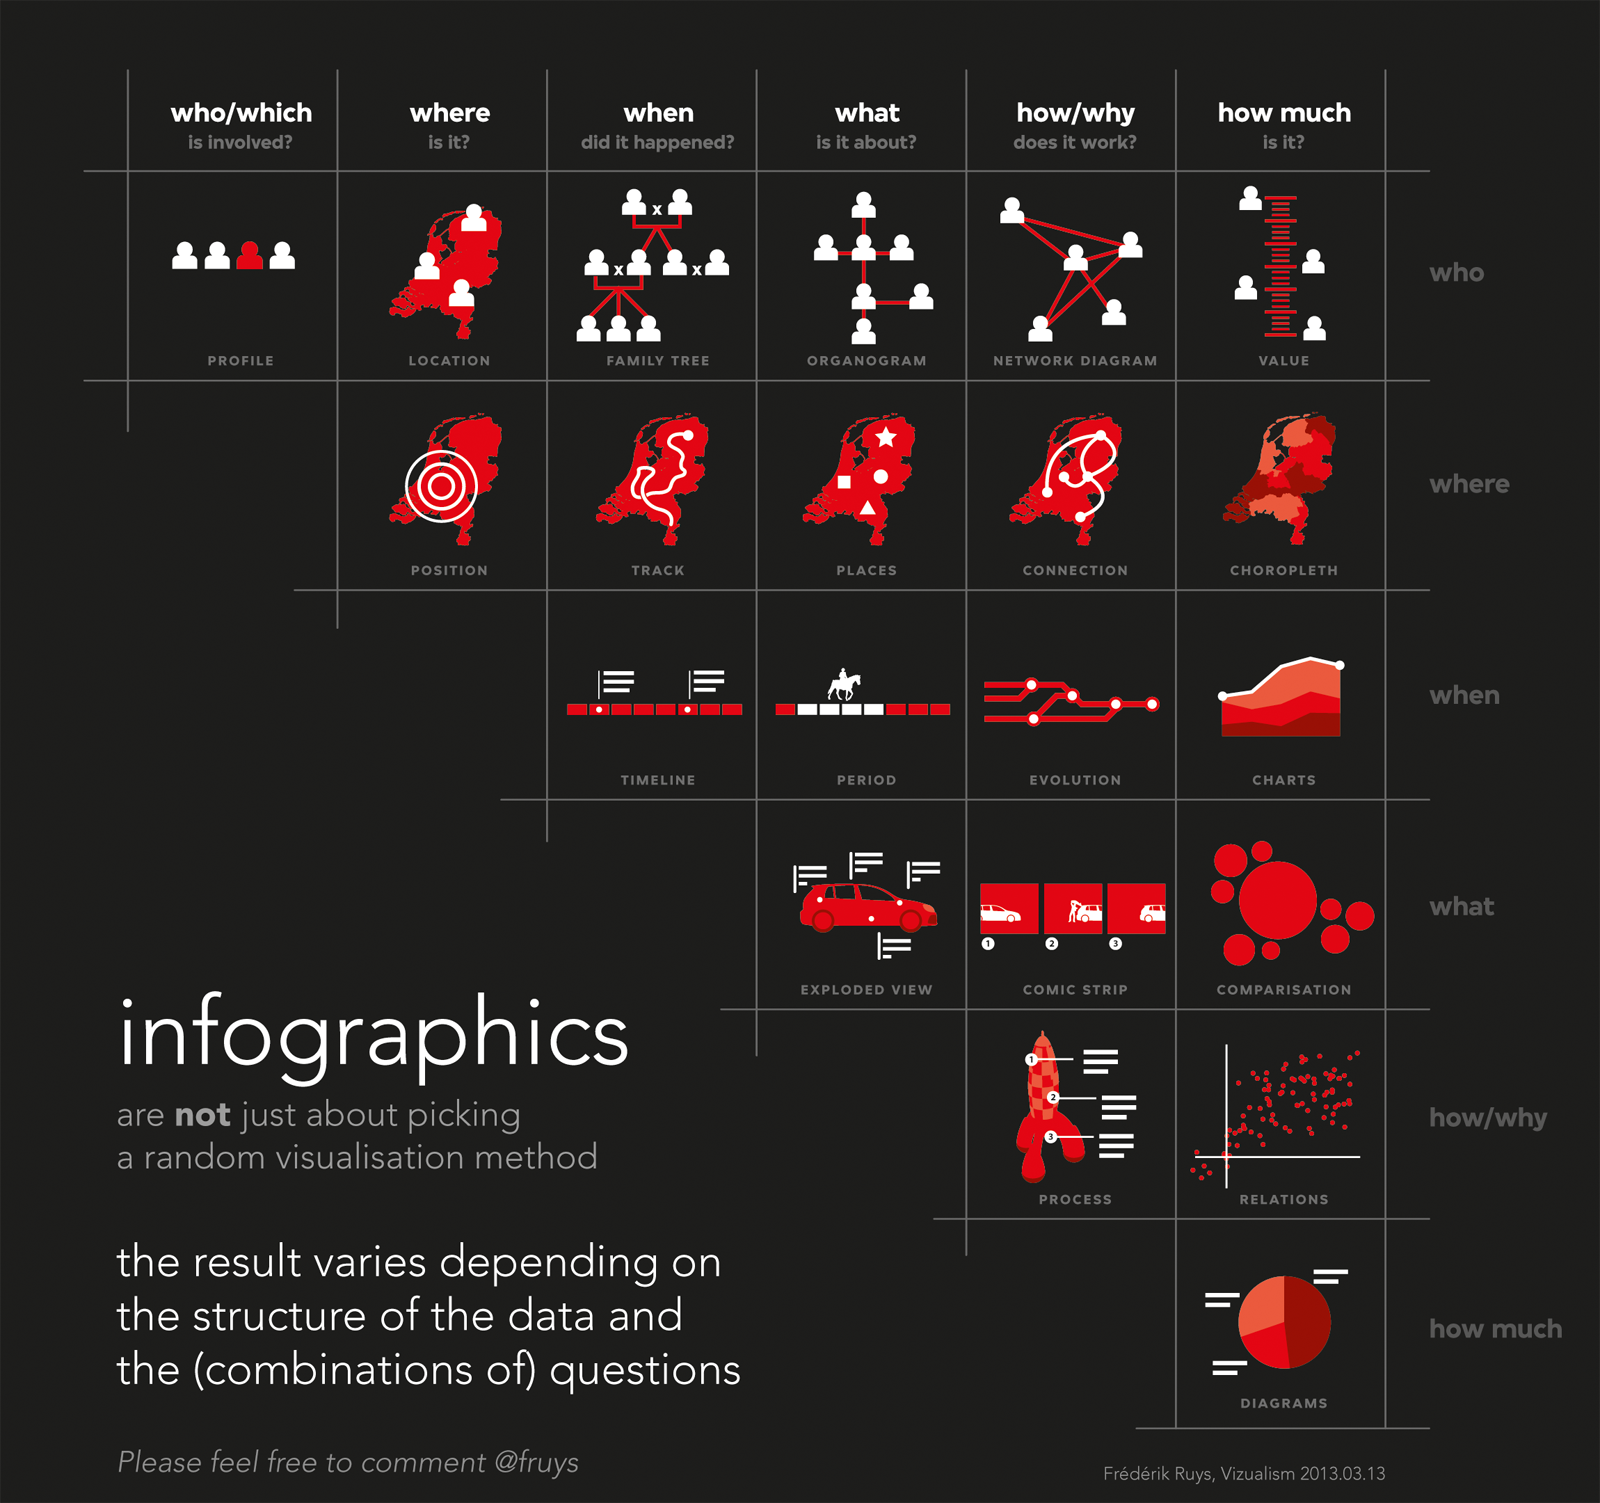
Gesorteerd op visualisatievorm. (⏹ = voorbeeld van een toepassing)
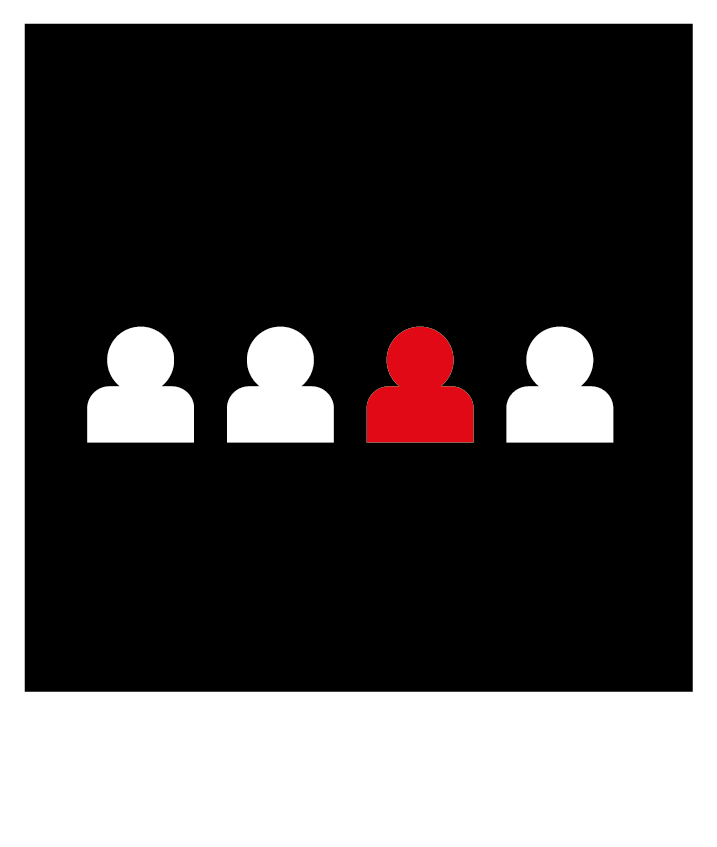
Lettergrootte afhankelijk van woordfrequentie:
  • Woordwolk ⏹
Positie bepaald door geografische lokatie:
  • Kepler
  • Carto * ⏹
  • Flourish
  • Datawrapper
  • Maps4News
  • CADmapper
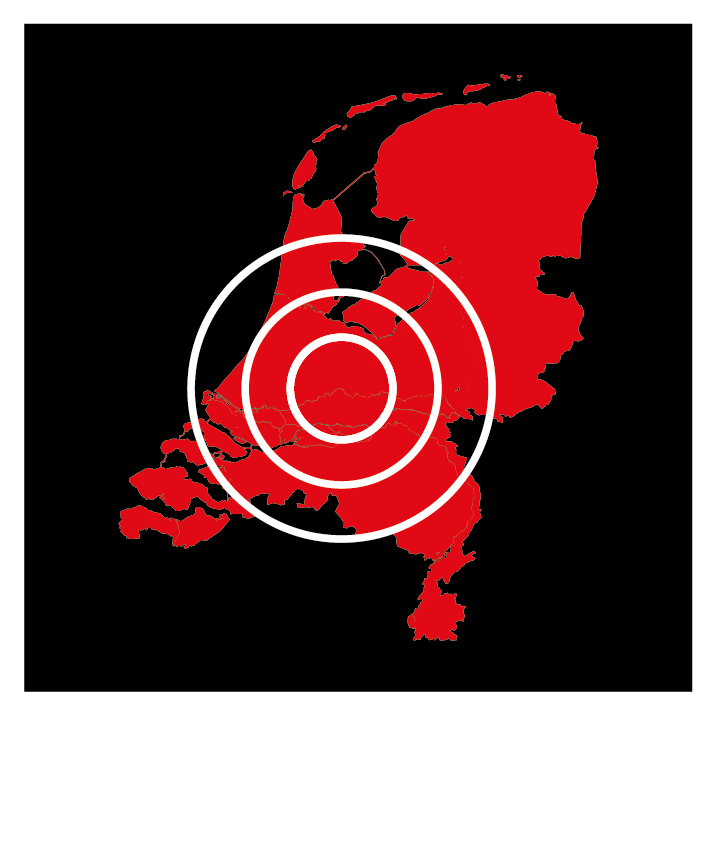
Koppelen van gebeurtenissen aan moment of periode (datum/tijd):
  • Timeline JS
Maken van (3D) illustratie + toevoegen van labels:
  • Thinglink ⏹
  • SketchUp  WIN ⏹
  • Sketchfab.com ⏹ ⏹
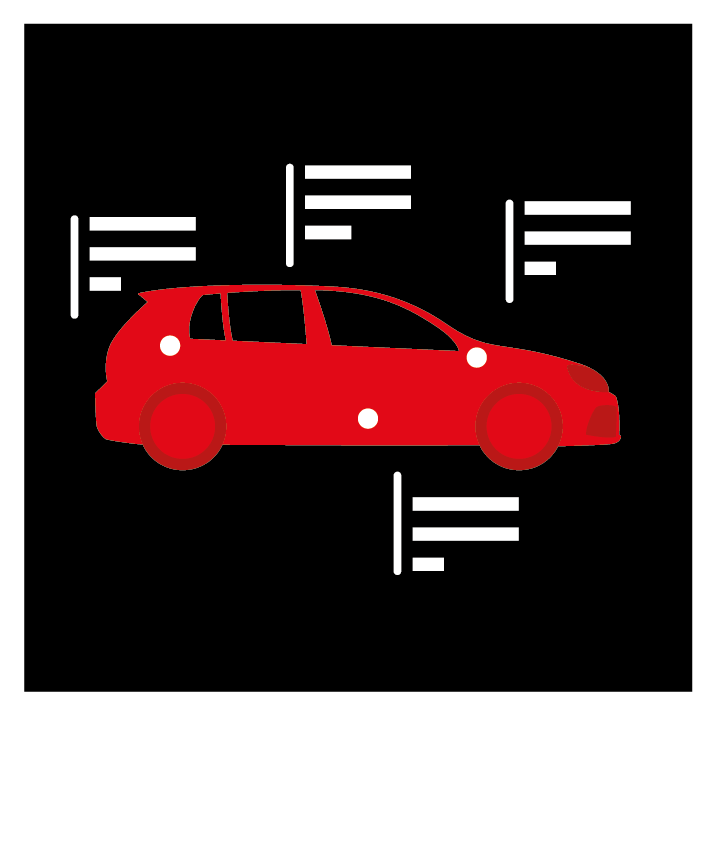
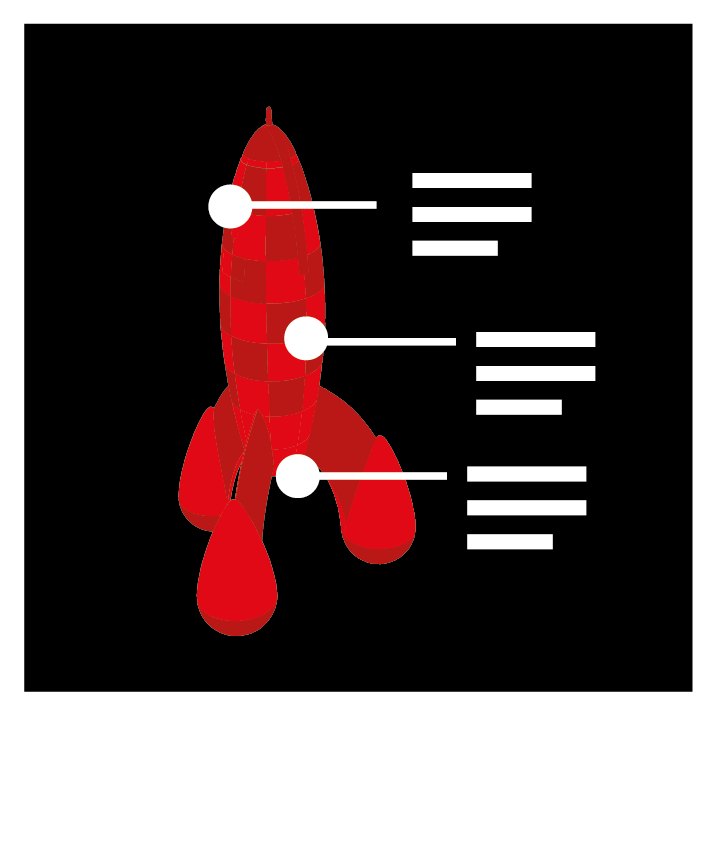
Toevoegen van labels aan bestaande illustratie:
  • Canva
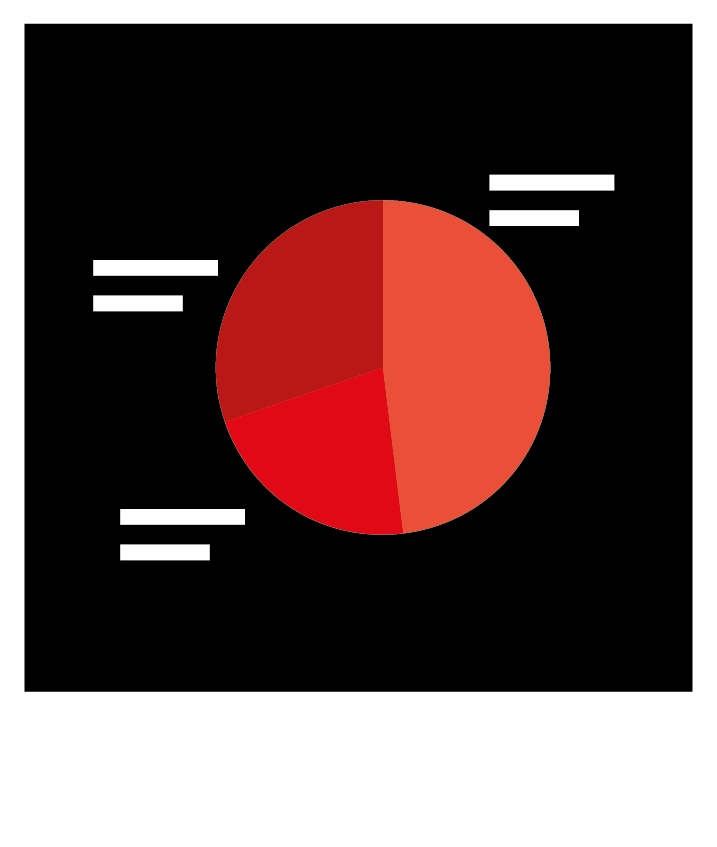
Waardes bepalen positie/kleur/vorm/grootte (datavisualisaties):
  • Datawrapper
  • Charticulator
  • RAWgraphs⏹
  • Data-Illustrator ⏹
  • SandDance
  • Projector

Download

  • Visualisatie Tips
  • Visualisatie matrix
  • Stappenplan van een data journalist
  • Bouw je eigen ‘solar graph’


Related

  • Beveiligd: Infographics Crash Course | Wageningen Marine Research
  • Beveiligd: Keynote Gelders Platform Milieu
  • Beveiligd: Inspiratiesessie KvK Utrecht 2019
  • Beveiligd: Tilt live
  • Beveiligd: Provincie Utrecht
  • Workshop FNV
  • DMJX 2019
  • VOGIN IP-lezing
  • Media Perspectives Hilversum
  • Gastles GMD Aeres
  • Herdenking Watersnoodramp Ouwerkerk 2019
  • Workshop Drents Overijsselse Delta
  • Hogeschool van Amsterdam 2019
  • Beveiligd: Workshop RDW
  • Workshop HKU
  • Beveiligd: Business Analytics København 2018
  • Beveiligd: Workshop Data Academy Zaanstreek Waterland
  • VU Infographics
  • Beveiligd: SDG Dataviz Camp UT
  • Beveiligd: Analitiqs
2018.12.13 // slides
  • Blog
    • Projects
      • Quest
      • Column VN
      • I ❤ Utrecht
      • Onzichtbaar NL
      • NL van Boven
        • dvd
        • TV Season 1
        • TV Season 2
        • Atlas
    • Honors & awards
    • Funny
  • Infographics
    • Media types
      • Visualization
      • Animation
      • Interaction
      • Datasculption
    • Taxonomy
      • Who
      • Where
      • When
      • What
      • How
      • How much
    • Clients
      • Non-profit
      • Educational
      • Governmental
      • Editorial
      • Corporate
  • Publications
    • Bibliography
    • Interviews
    • Videos
  • Downloads
    • slides
    • client area
  • Workshops
    • Dataviz Festival
    • Agenda
    • Tutorials
    • Crash Course
    • Databorrels
  • Contacts
    • Biography
    • Address
    • Faq

Home Collegetour KPN

As one of the leading information design agencies, Vizualism helps government and assessment agencies with visual storytelling to address complex issues to the public. Founding partner Frederik Ruys is also co-organizer of the Dutch Infographic Conferences, guest-lecturer in visual storytelling and provides training to international news organizations and corporate communication officers.
But above all we love to learn every day new stuff.

Contact

Follow us at Twitter and LinkedIn. Any questions? Send us a message info@vizualism.com or give us a call: +31 621 – 4000 46.

Copyright 2013 / 2019

Gerealiseerd door Nicetoclick

  • Pinterest
  • Facebook
  • Twitter
  • Youtube
  • Linkedin