• Pinterest
  • Facebook
  • Twitter
  • Youtube
  • Linkedin
  • Login
  • Registration
  • Portfolio
    • Chantal
    • Frédérik
      • Onzichtbaar NL
      • NL van Boven
        • dvd
        • TV Season 1
        • TV Season 2
        • Atlas
      • I ❤ Utrecht
      • Weer
      • Funny
    • Awards
  • Infographics
    • Media types
      • Visualization
      • Animation
      • Interaction
      • Datasculption
    • Taxonomy
      • Who
      • Where
      • When
      • What
      • How
      • How much
    • Clients
      • Non-profit
      • Educational
        • musea
        • Teylers Museum
        • anne frank stichting
      • Governmental
        • KNMI
        • CPB
        • PBL
        • RLI
        • RIVM
        • rijksoverheid
        • gemeenten
      • Editorial
        • FD
        • Quest
        • VN
        • NPO
      • Corporate
        • Schiphol
        • Rabobank
  • Publications
    • Bibliography
    • Interviews
    • Videos
  • Downloads
    • slides
    • client area
  • Workshops
    • Dataviz Festival
    • Agenda
    • Tutorials
    • Crash Course
    • Databorrels
  • Contact
    • Biography

Beschermd: Inspiratiesessie Tensing

Vrijdag 30 oktober 2020

Bekijk
2020.10.25 // slides

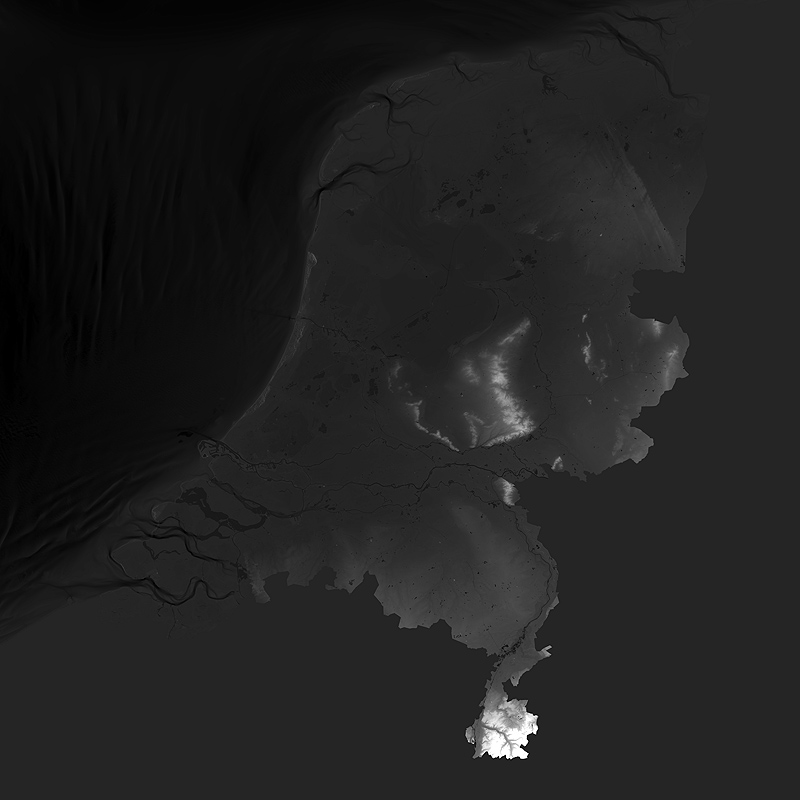
Beschermd: Hoogte data NL

Bekijk
2020.07.29 // Downloads

Portfolio Chantal van Wessel

Portfolio Chantal

Bekijk
2020.07.27 // Downloads

Beschermd: Inbraakvrijewijk

inbraakvrijewijk

Bekijk
2020.06.07 // clients

Beschermd: Time Machine Amsterdam [vpro]

Pieter de Graeff
20 mei 2020

Bekijk
2020.05.20 // clients

Beschermd: Data inventarisatie Waddenzee 3D-animatie

Data

Bekijk
2020.05.13 // clients

Universiteit Twente

Datavisualisatie UT
28 mei 2024

Bekijk
2020.04.28 // slides

Talk @ Time Machine hackaton

Bekijk
2020.02.06 // slides

Beschermd: Grafisch Lyceum Rotterdam | 2020

Datavisualisatie GLR
6 januari 2020

Bekijk
2020.01.06 // slides

Introductie Infographics | AVANS

17 december 2019
Frederik Ruys

Bekijk
2019.12.17 // slides
  • <
  • 1
  • 2
  • 3
  • 4
  • 5
  • 6
  • 7
  • 8
  • 9
  • 10
  • 11
  • 12
  • 13
  • >
  • Portfolio
    • Chantal
    • Frédérik
      • Onzichtbaar NL
      • NL van Boven
        • dvd
        • TV Season 1
        • TV Season 2
        • Atlas
      • I ❤ Utrecht
      • Weer
      • Funny
    • Awards
  • Infographics
    • Media types
      • Visualization
      • Animation
      • Interaction
      • Datasculption
    • Taxonomy
      • Who
      • Where
      • When
      • What
      • How
      • How much
    • Clients
      • Non-profit
      • Educational
        • musea
        • Teylers Museum
        • anne frank stichting
      • Governmental
        • KNMI
        • CPB
        • PBL
        • RLI
        • RIVM
        • rijksoverheid
        • gemeenten
      • Editorial
        • FD
        • Quest
        • VN
        • NPO
      • Corporate
        • Schiphol
        • Rabobank
  • Publications
    • Bibliography
    • Interviews
    • Videos
  • Downloads
    • slides
    • client area
  • Workshops
    • Dataviz Festival
    • Agenda
    • Tutorials
    • Crash Course
    • Databorrels
  • Contact
    • Biography

As one of the leading information design agencies, Vizualism helps government and assessment agencies with visual storytelling to address complex issues to the public. Founding partner Frederik Ruys is also co-organizer of the Dutch Infographic Conferences, guest-lecturer in visual storytelling and provides training to international news organizations and corporate communication officers.
But above all we love to learn every day new stuff.

Contact

Follow us at Twitter and LinkedIn. Any questions? Send us a message info@vizualism.com or give us a call: +31 621 – 4000 46.

Copyright 2013 / 2026

Website gerealiseerd door RIFF Online.

  • Pinterest
  • Facebook
  • Twitter
  • Youtube
  • Linkedin