Pinterest
Facebook
Twitter
Youtube
Linkedin
Portfolio
Chantal
Frédérik
Onzichtbaar NL
NL van Boven
dvd
TV Season 1
TV Season 2
Atlas
I ❤ Utrecht
Weer
Funny
Awards
Infographics
Media types
Visualization
Animation
Interaction
Datasculption
Taxonomy
Who
Where
When
What
How
How much
Clients
Non-profit
Educational
musea
Teylers Museum
anne frank stichting
Governmental
CPB
PBL
RLI
RIVM
rijksoverheid
gemeenten
Editorial
FD
Quest
VN
NPO
Corporate
Schiphol
Rabobank
Publications
Bibliography
Interviews
Videos
Downloads
slides
client area
Workshops
Dataviz Festival
Agenda
Tutorials
Crash Course
Databorrels
Contact
Biography
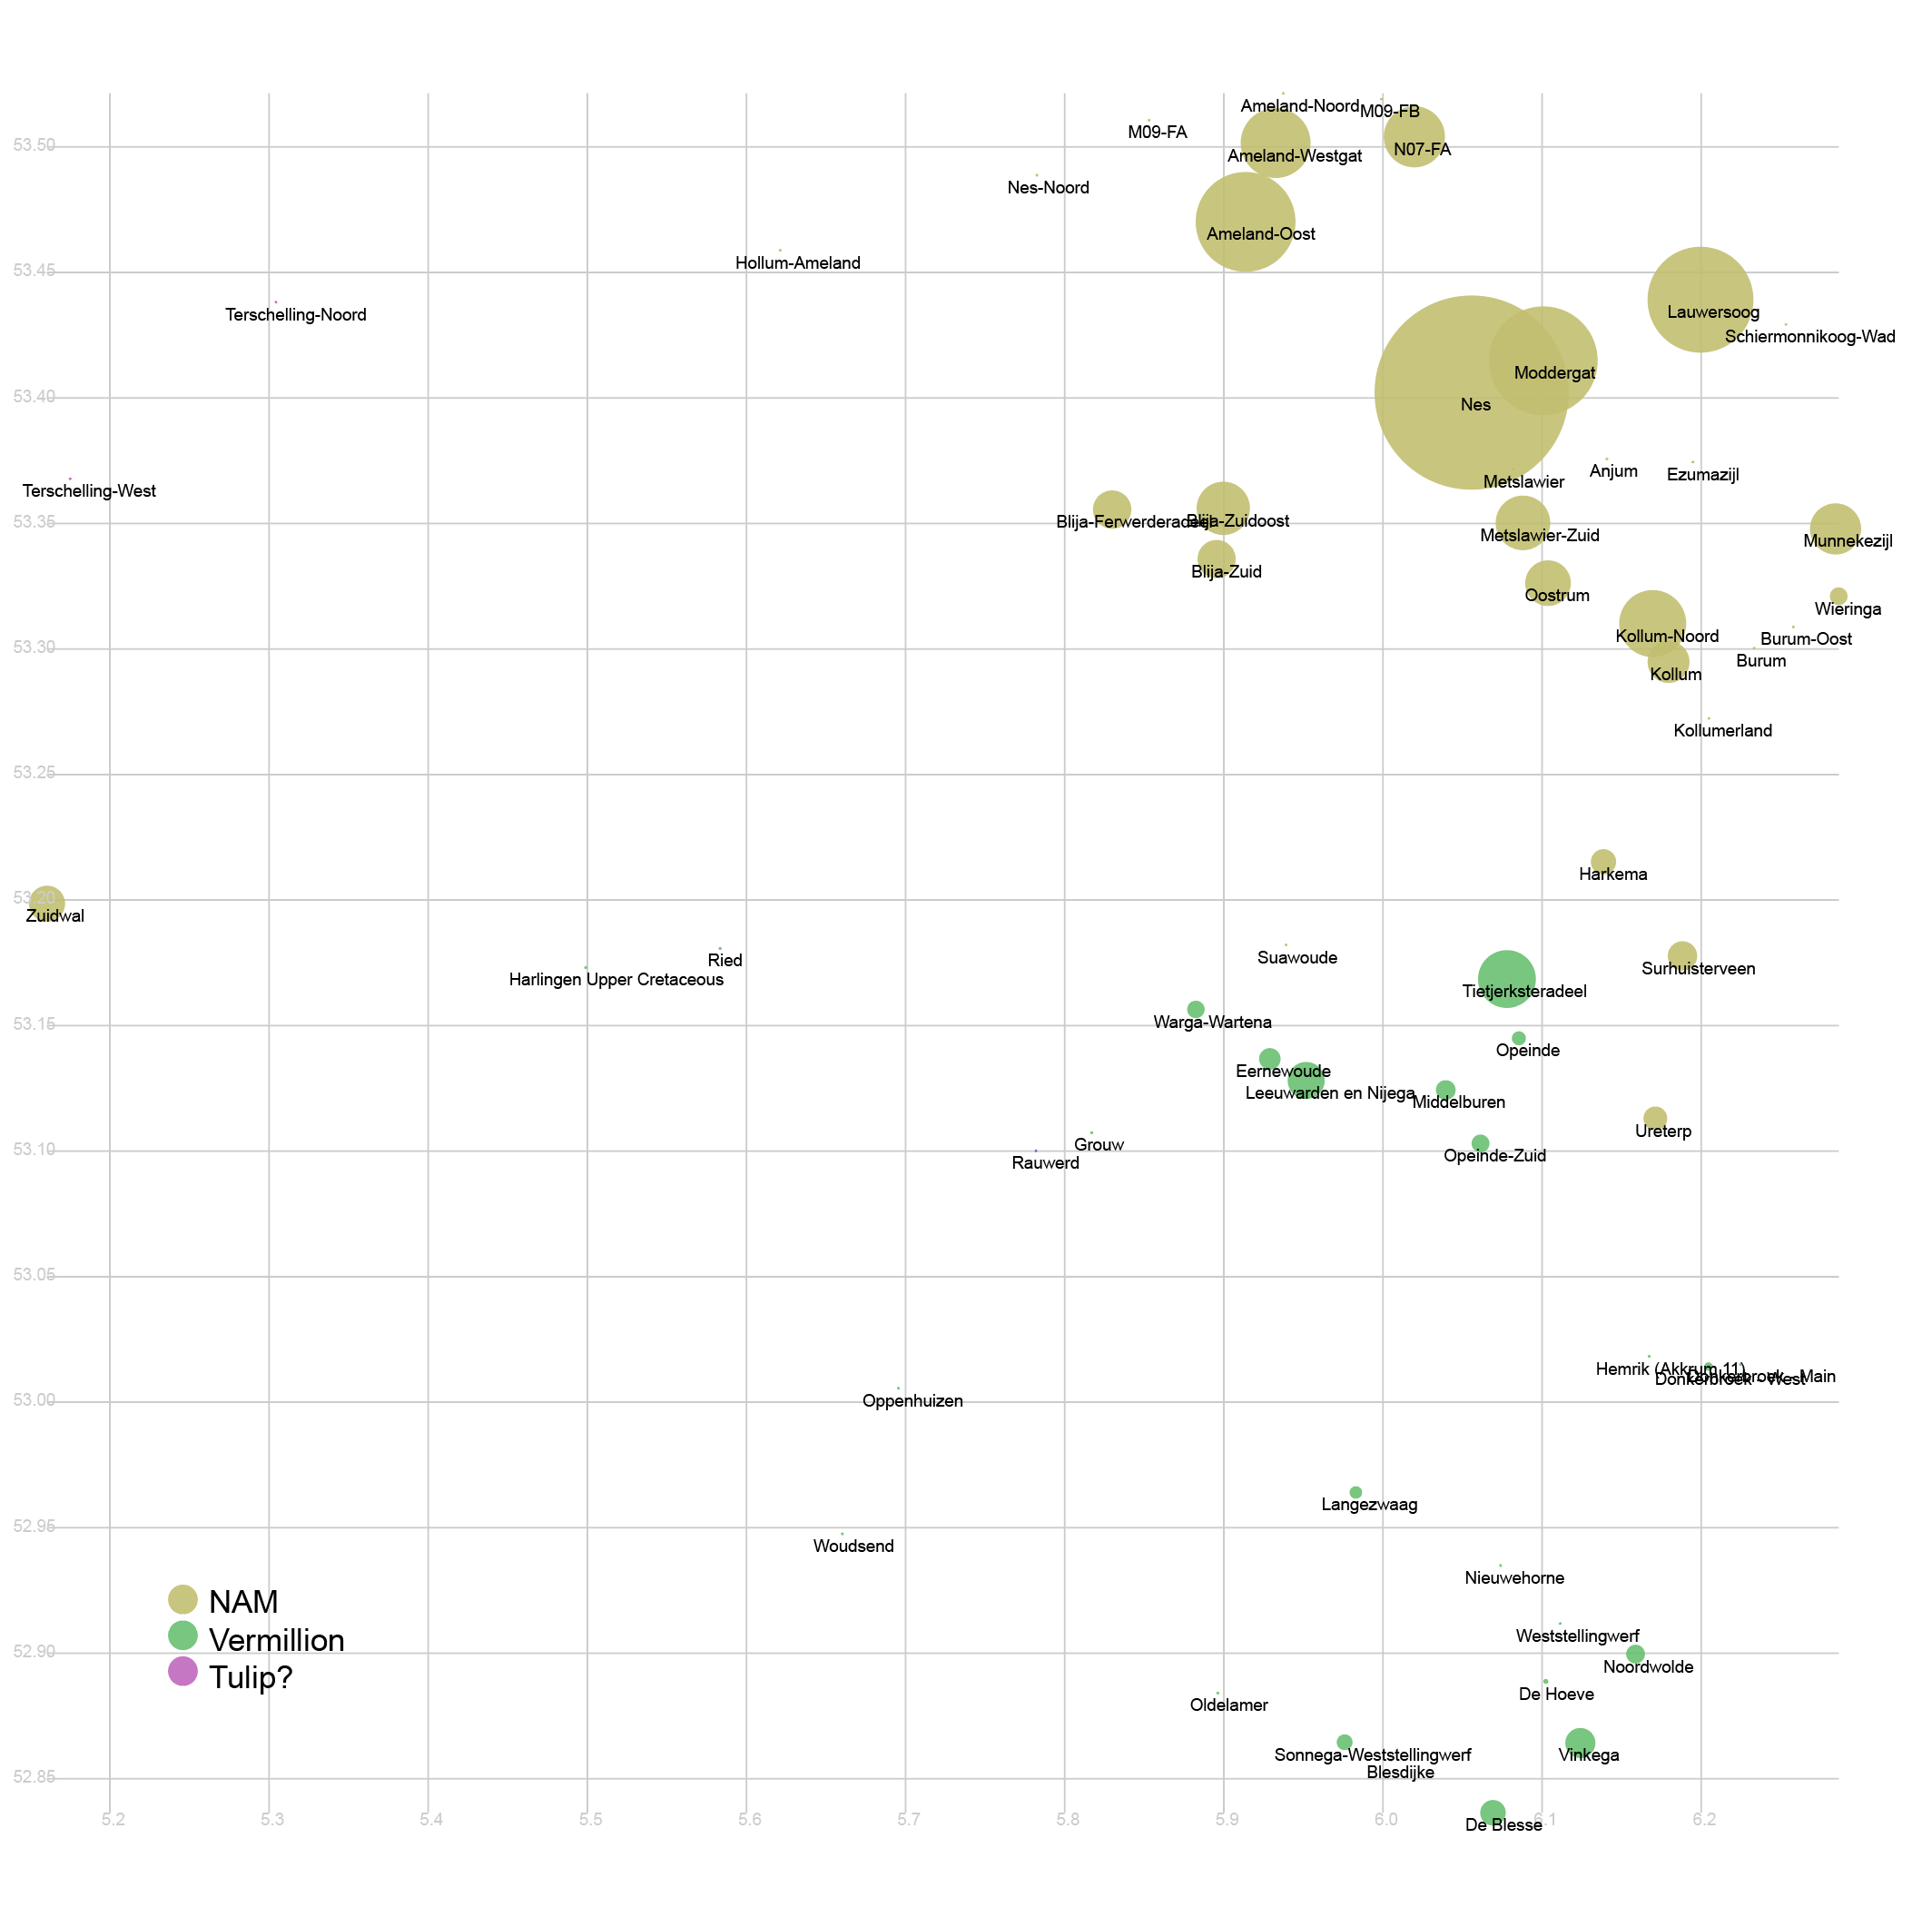
LC gasvelden TEST
TEST 1
TEST 2
Link naar 3D-aanzicht:
www.vizualism.nl/project/gaswinning
TEST 3
Related
Bestuurlijke regio’s
Beschermd: HCSS [rough cuts]
Vlonder Geofort
Beschermd: Oekraïne data
Westerschelde
Beschermd: Water-bodem-sedimentsysteem
Beschermd: VU-bibliotheek [TEST]
Beschermd: Inbraakvrijewijk
Beschermd: Time Machine Amsterdam [vpro]
Beschermd: Data inventarisatie Waddenzee 3D-animatie
Beschermd: Staatsschuld
Beschermd: NGF Inventarisatie
Beschermd: Snappet
Beschermd: Nominatie Geofort
Beschermd: Noordzee
Beschermd: BNO branchemonitor 2017
Beschermd: Midden-oosten Online | Keerpunt #1
Beschermd: Ministerie BZK
Overijssel 360°
Beschermd: Rechtspraak
2019.05.12
//
clients